
Welcome to our guide on generating AI insights from your interview sessions. This tutorial will show you how to extract significant patterns and findings from your data to gain a deeper understanding of the information collected.
Login to Engage
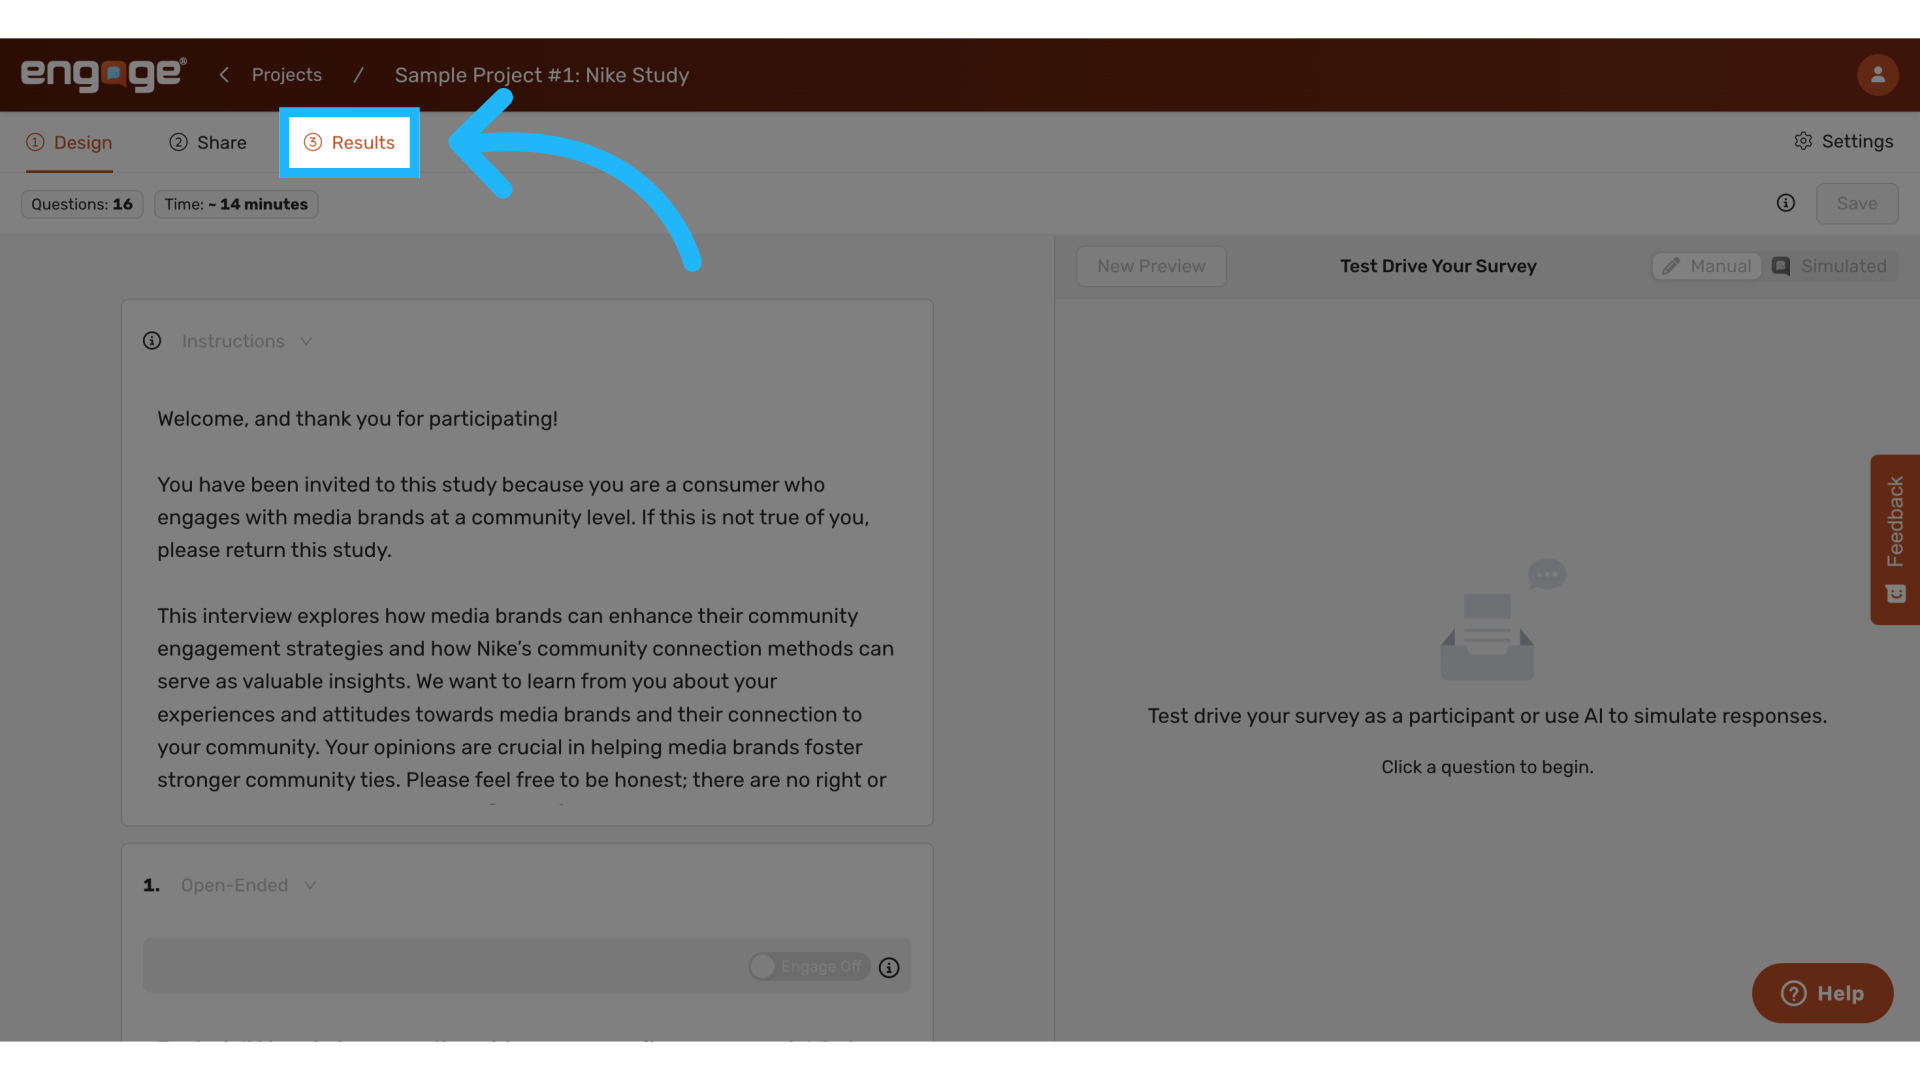
1. Navigate to Results
To get started, locate the results tab.
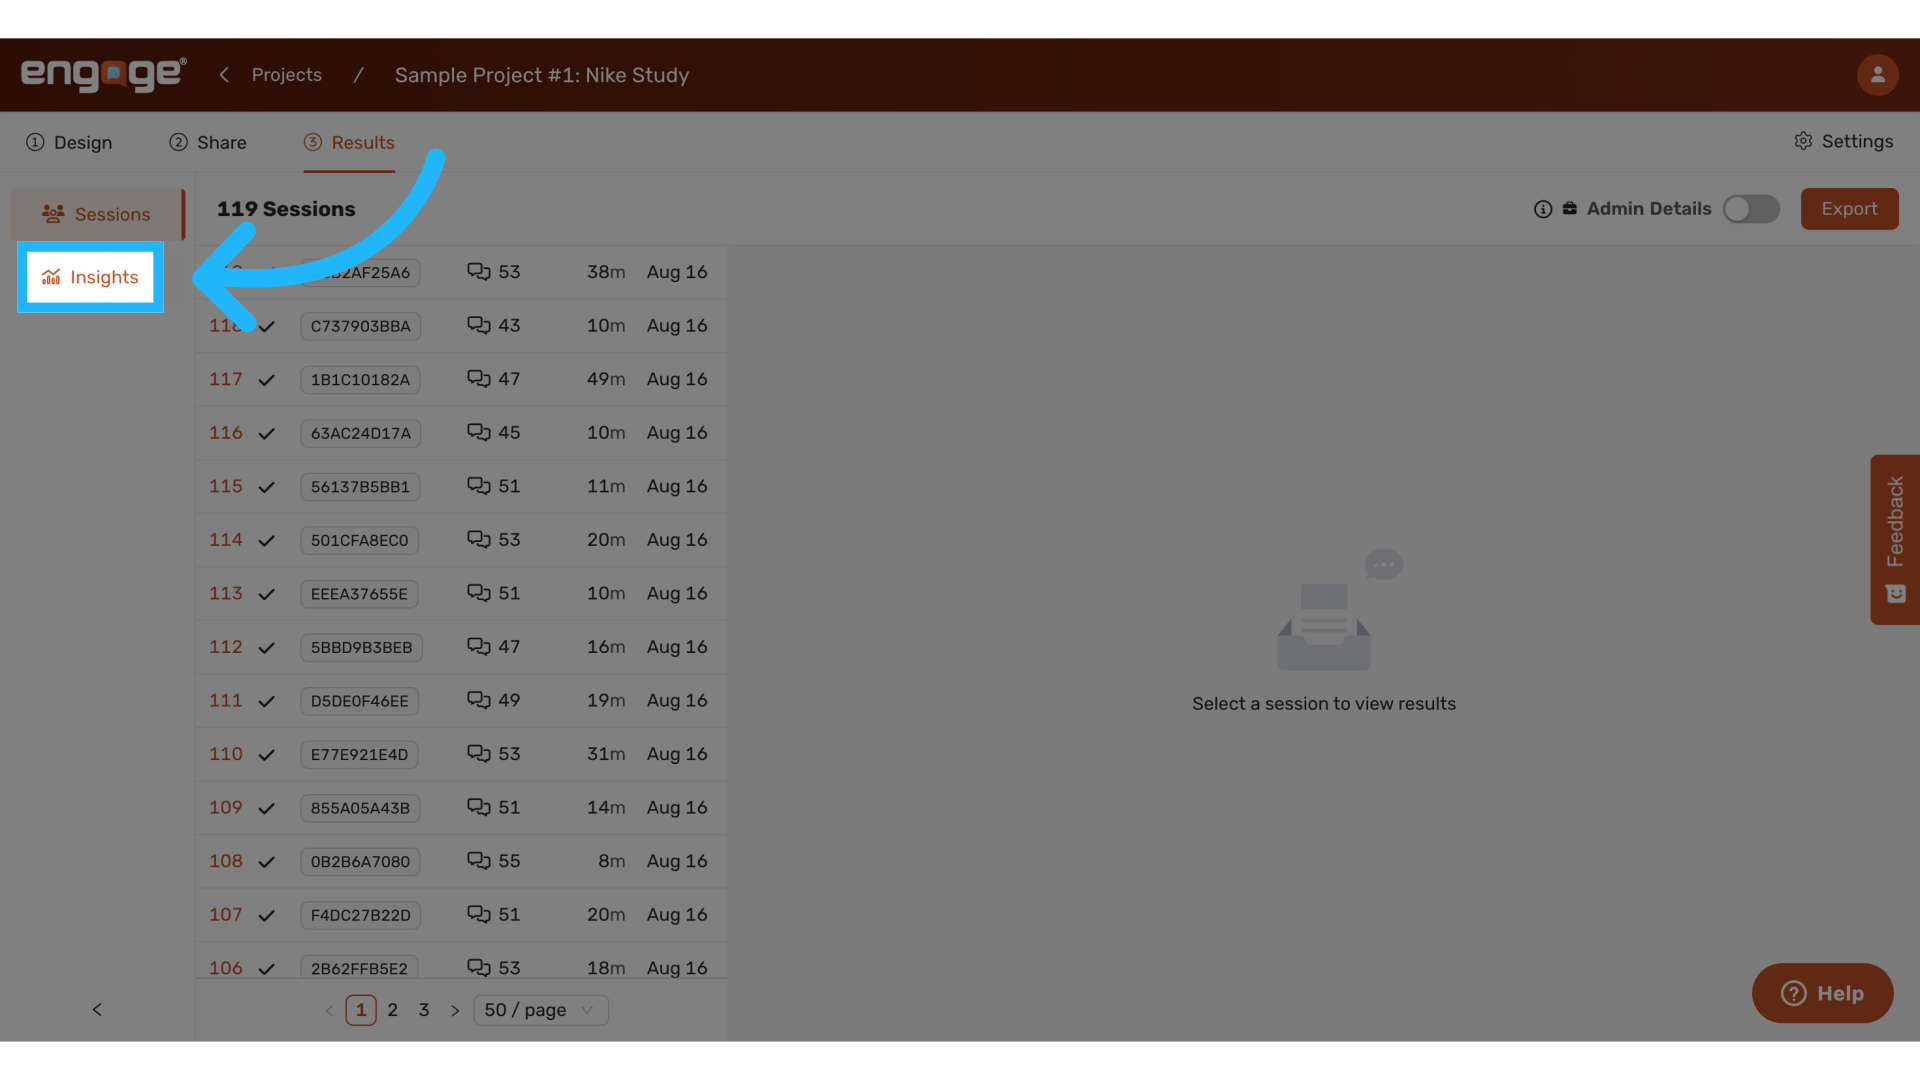
2. Access Insights
Select the "Insights" tab where you can analyze responses from your survey. This feature is especially useful for open-ended questions.
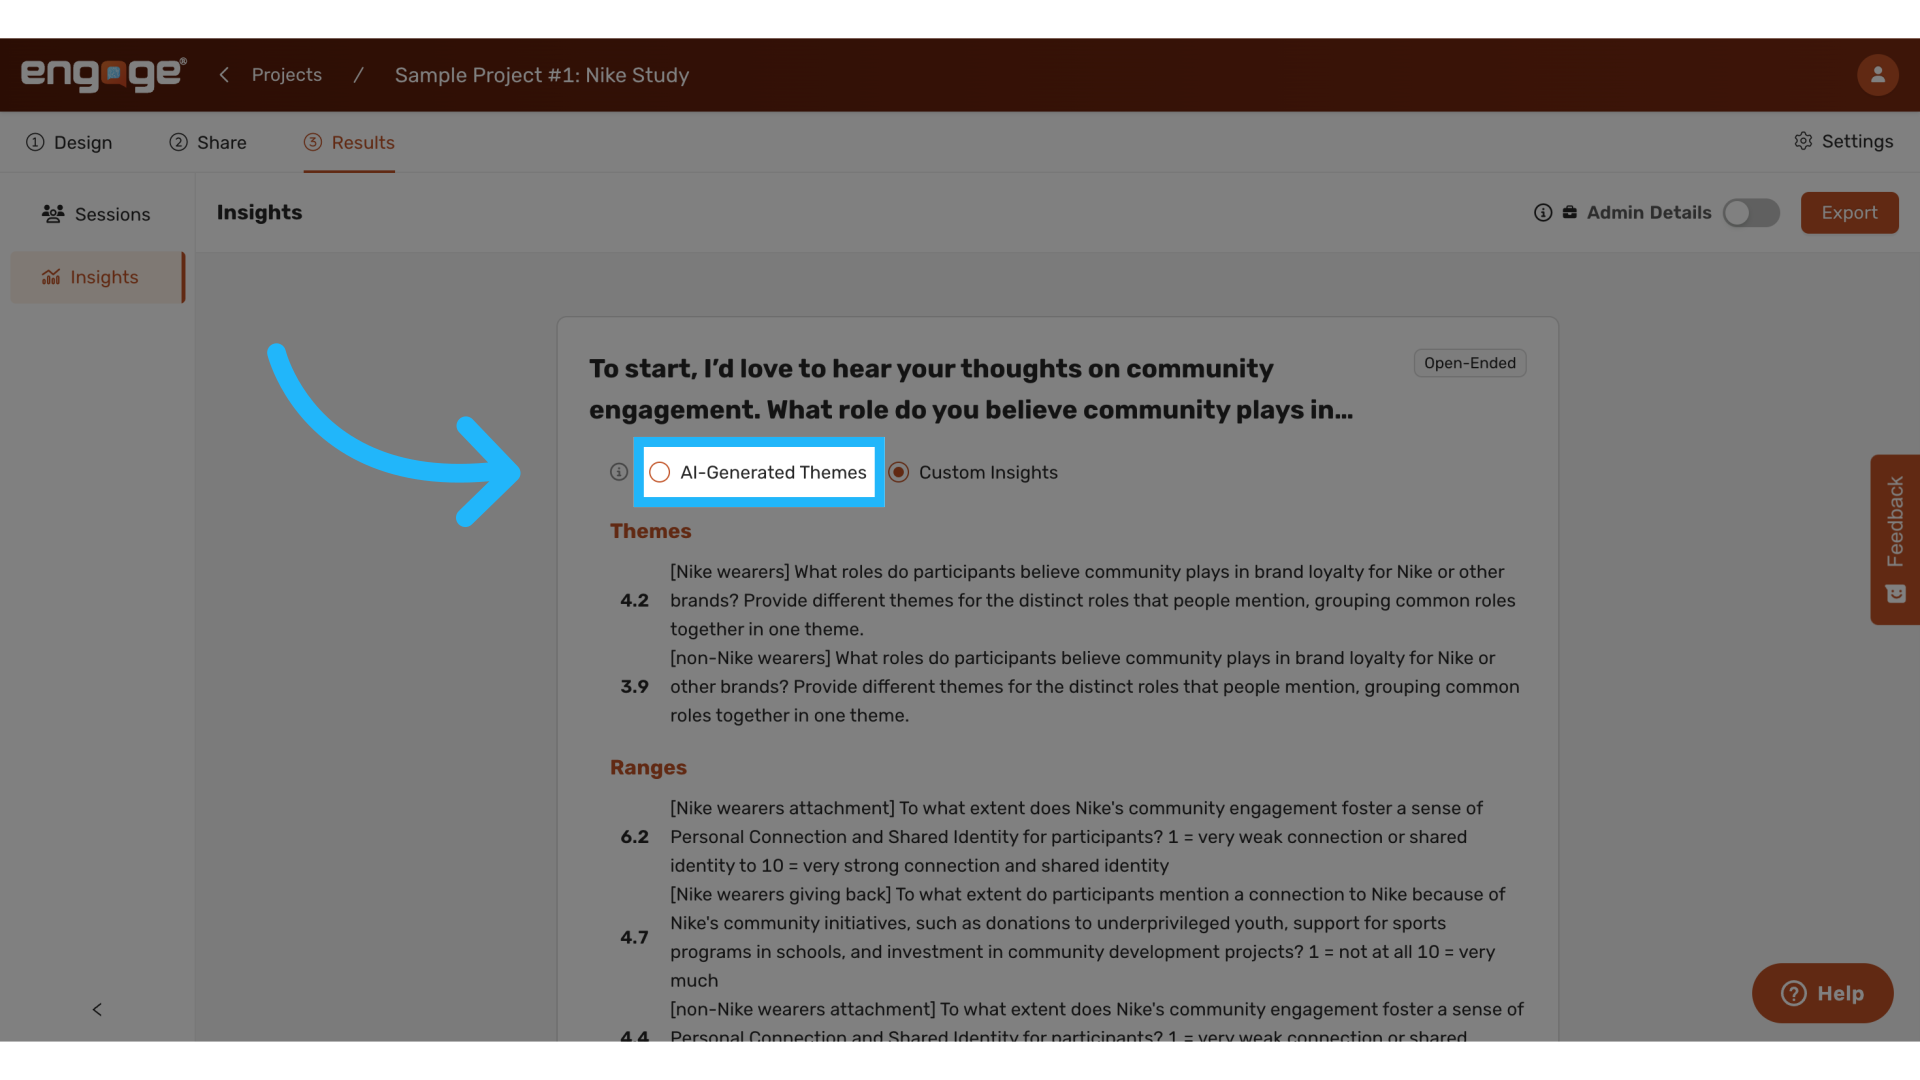
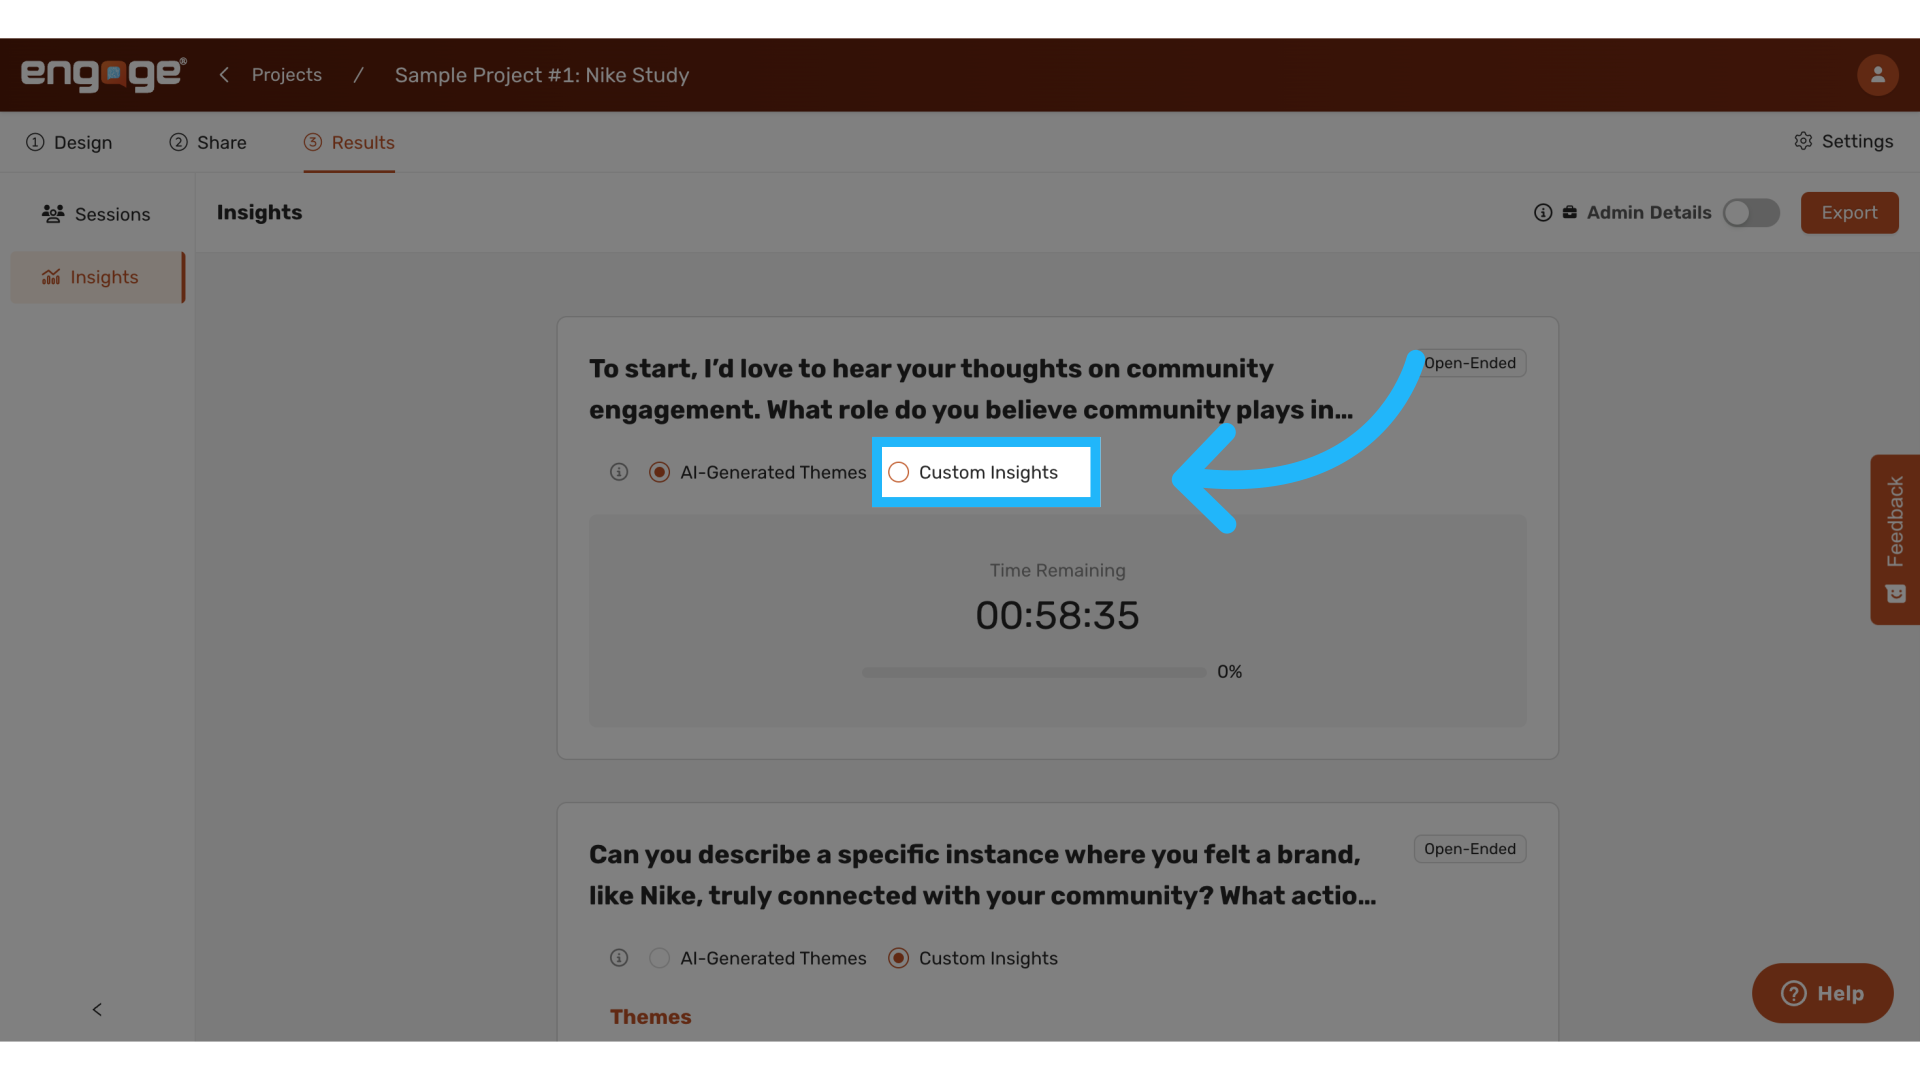
3. Choose AI Generated Insights
Opt for AI-generated themes or custom insights depending on your analysis needs. AI-generated themes analyze the data to identify prominent themes automatically.
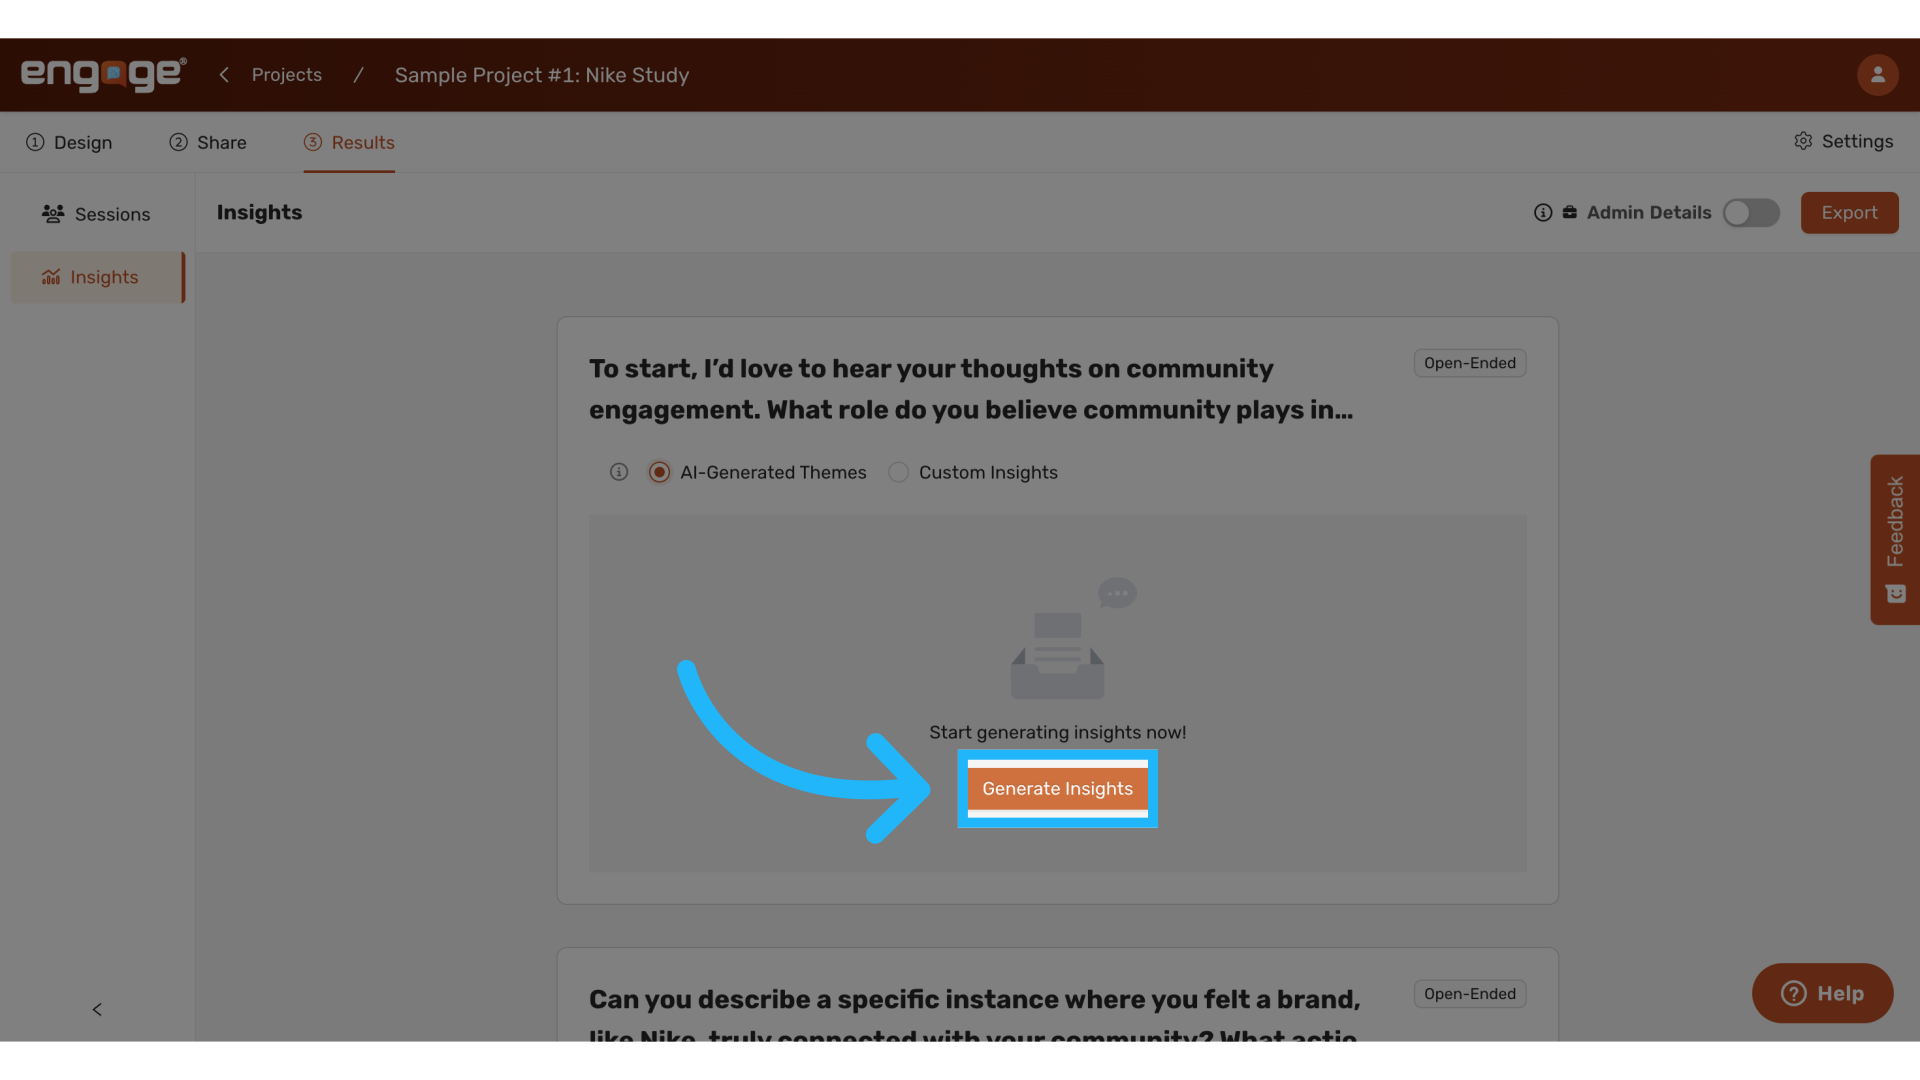
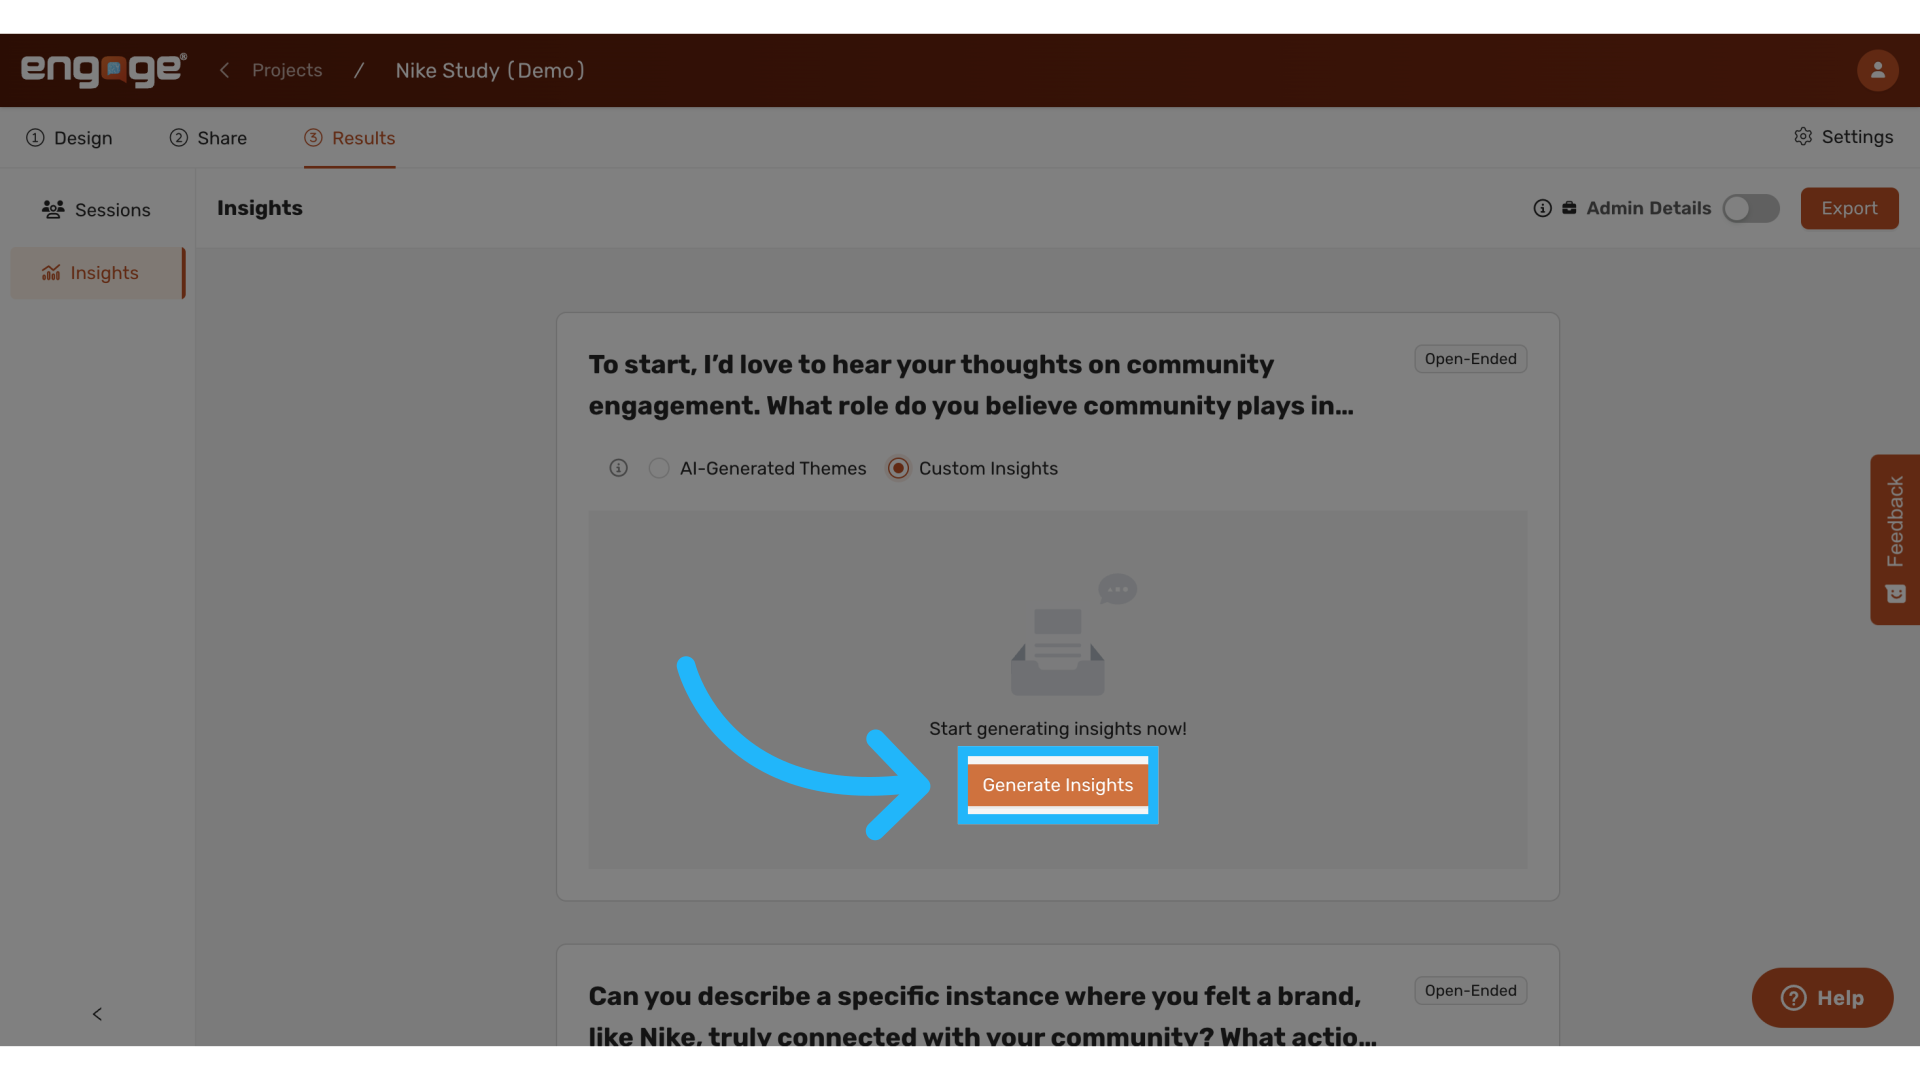
4. Generate Insights
Click on the "Generate Insights" button to start the process.
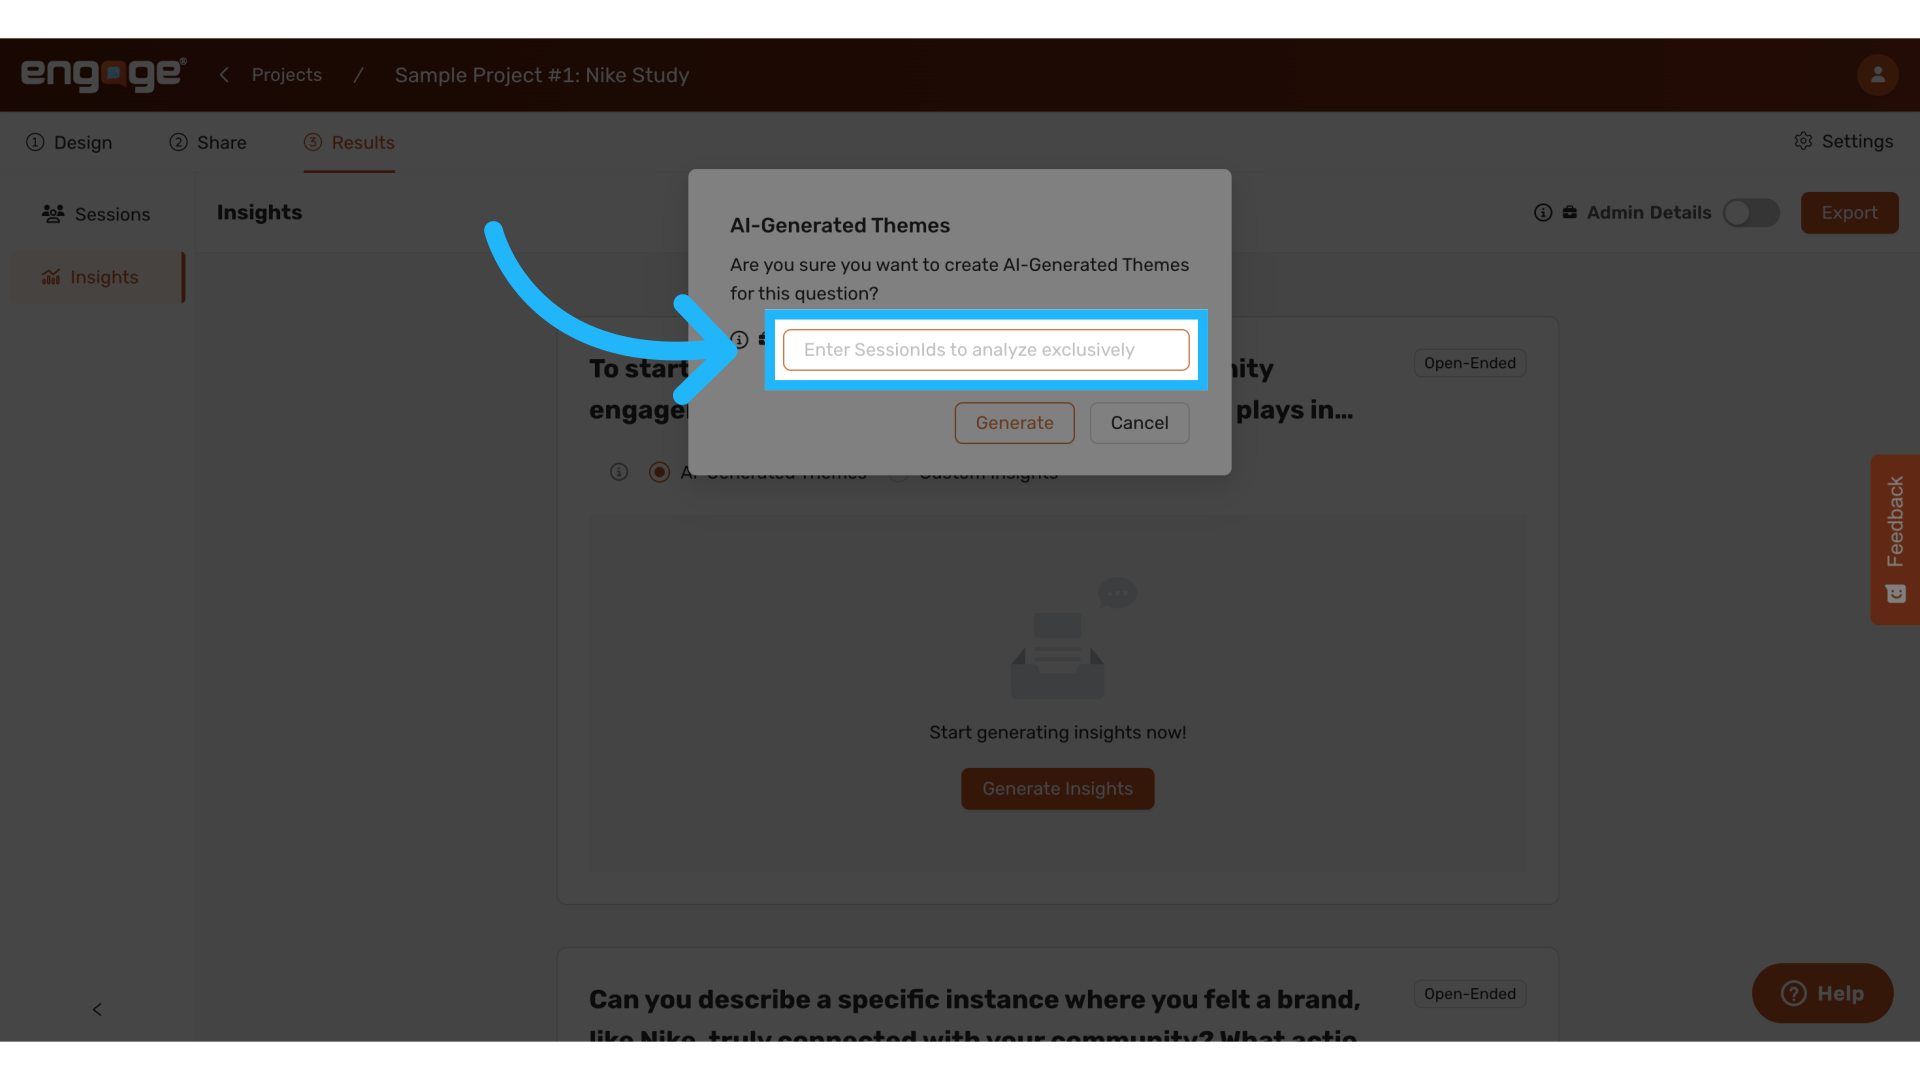
5. Specify Session IDs (Optional)
If desired, enter specific session IDs for exclusive analysis. This option is available from the CSV download of session data. If you leave this field empty, all sessions marked for inclusion will be analyzed.
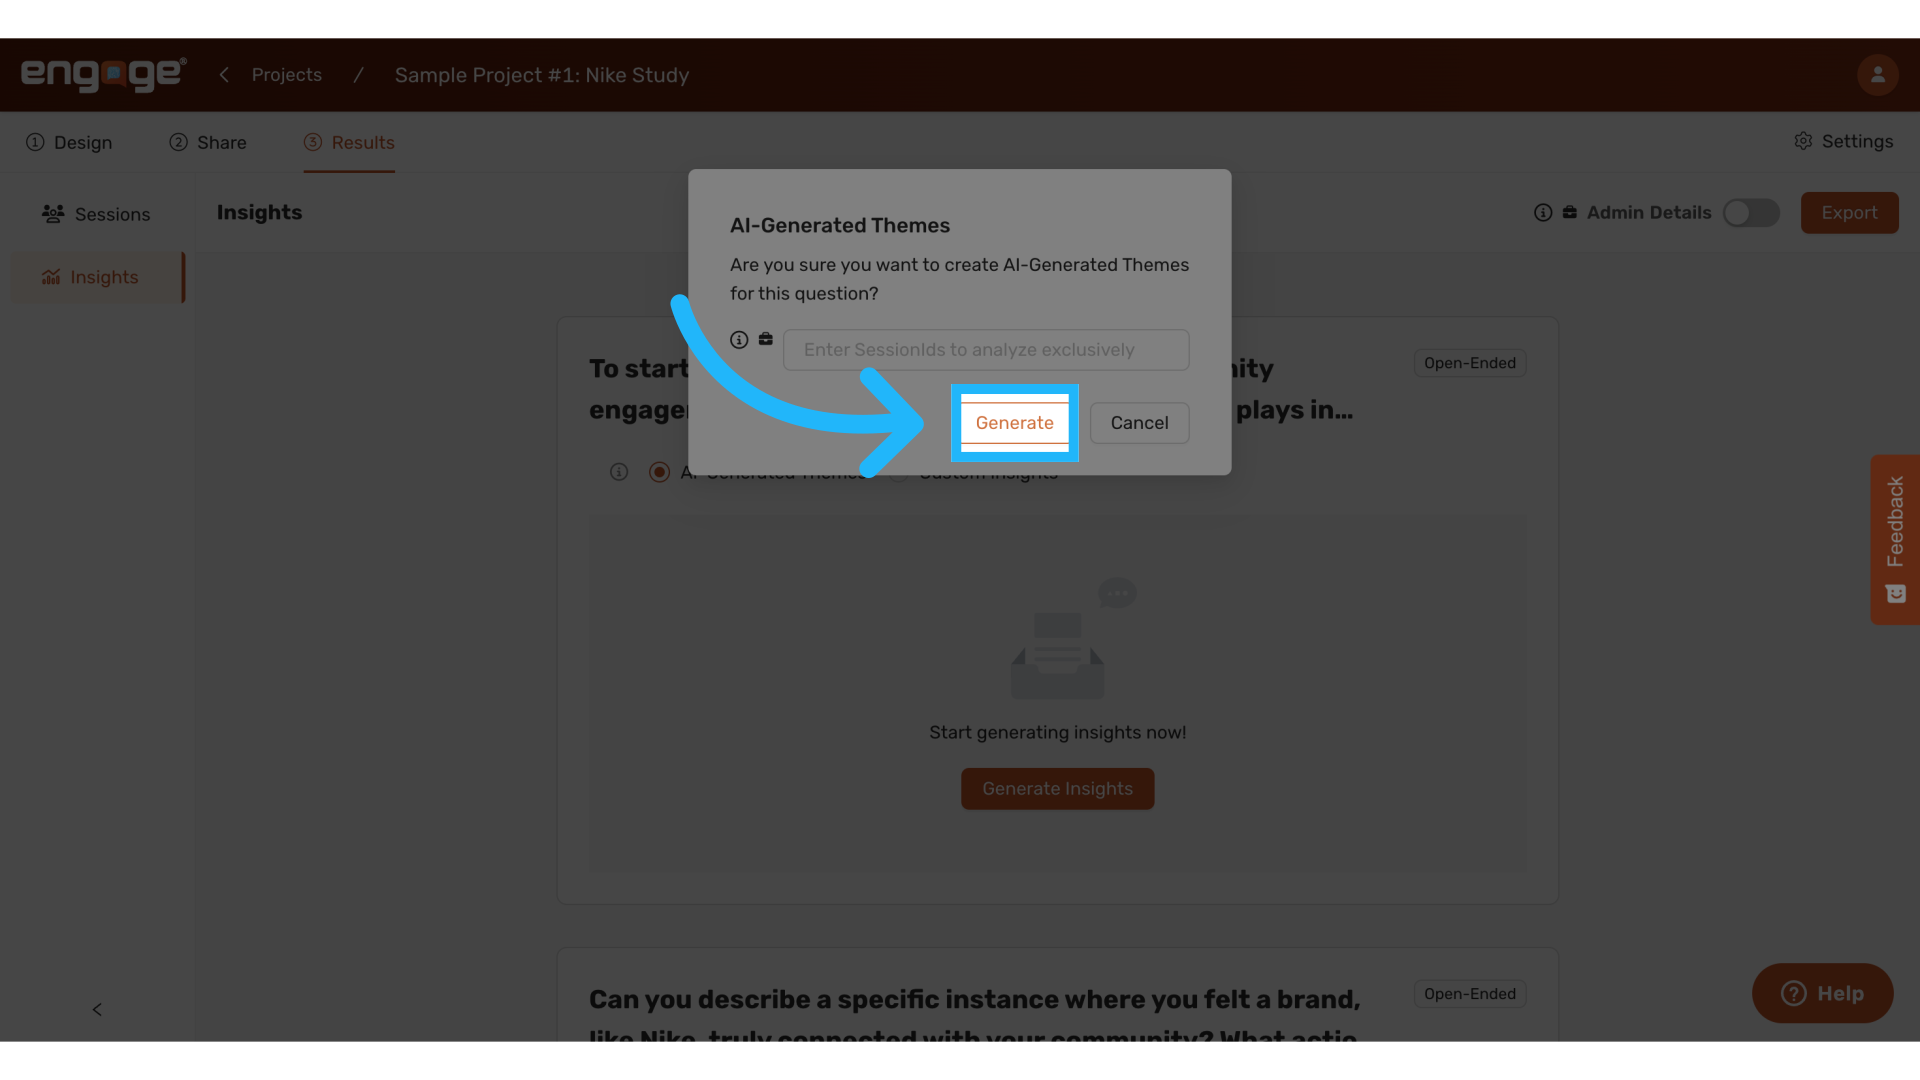
6. Click "Generate"
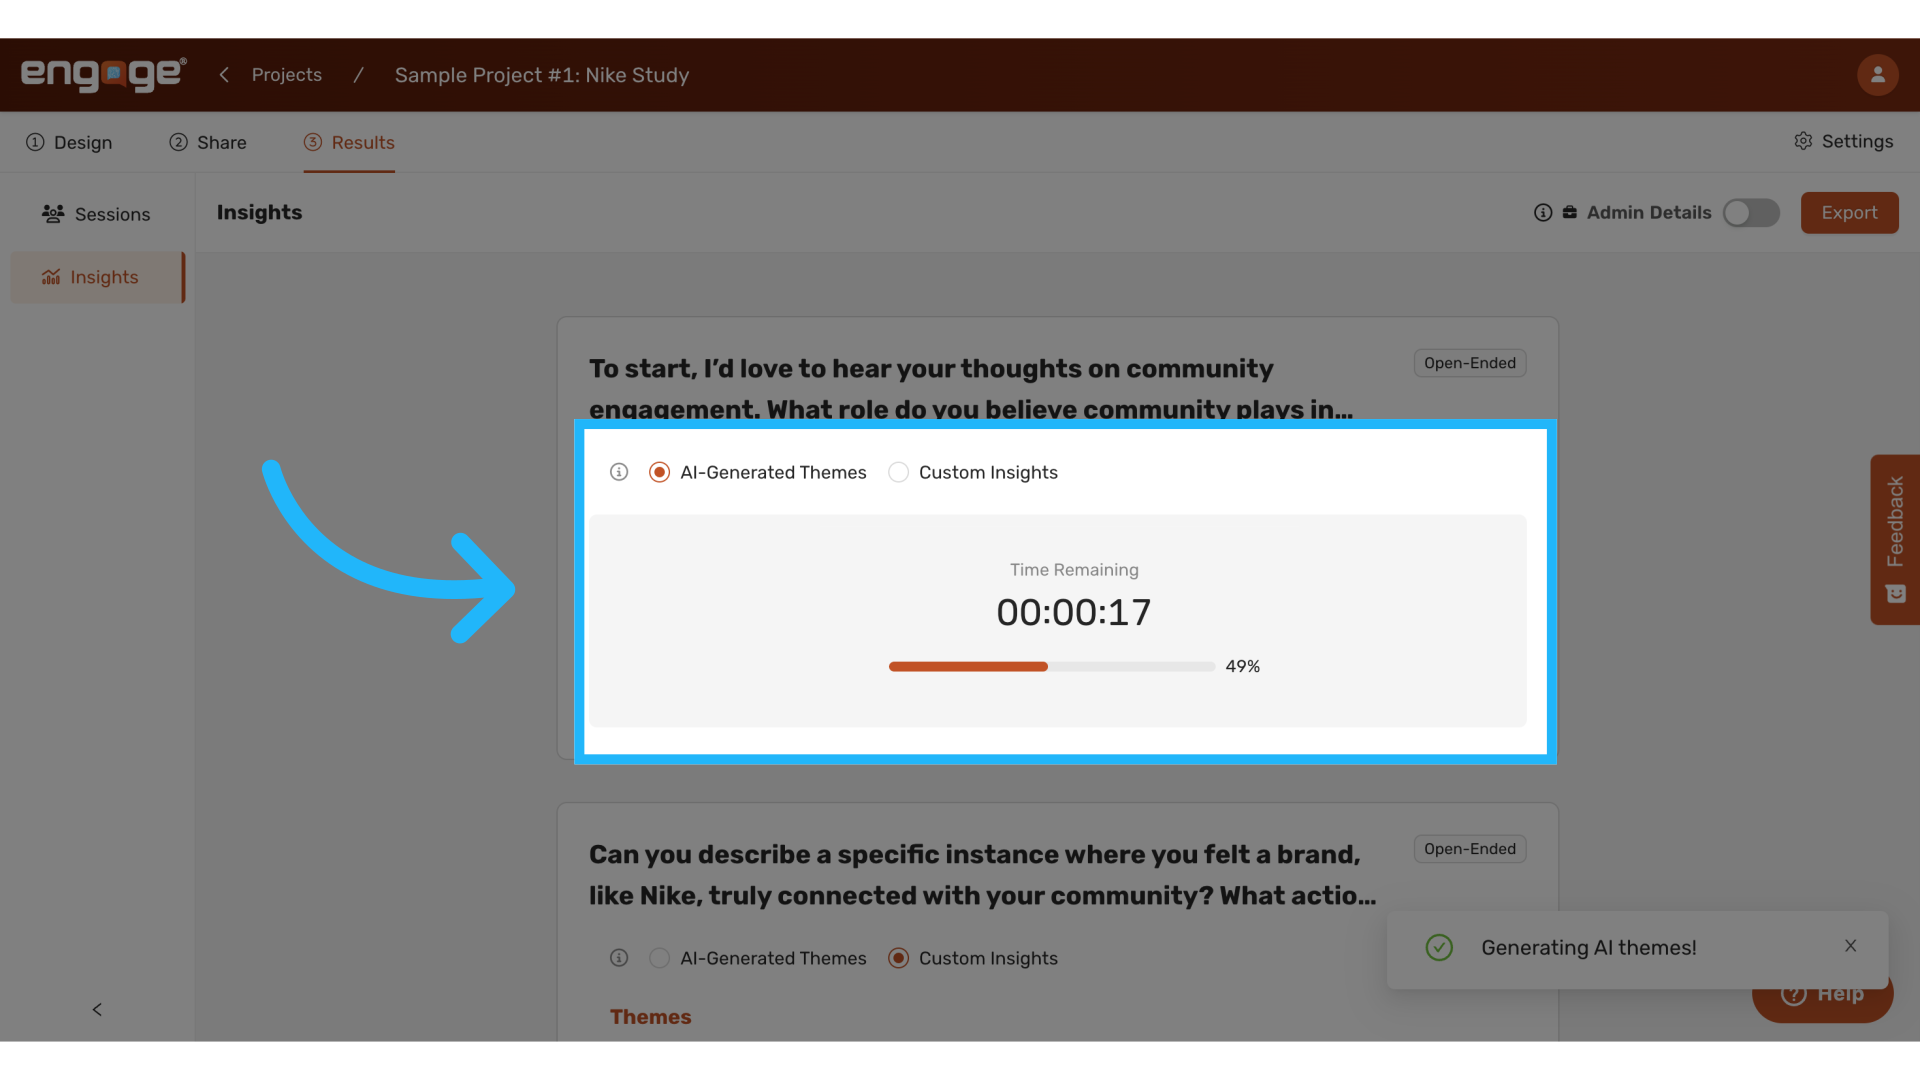
After initiating the generation, a timer will indicate the time required to complete the analysis.
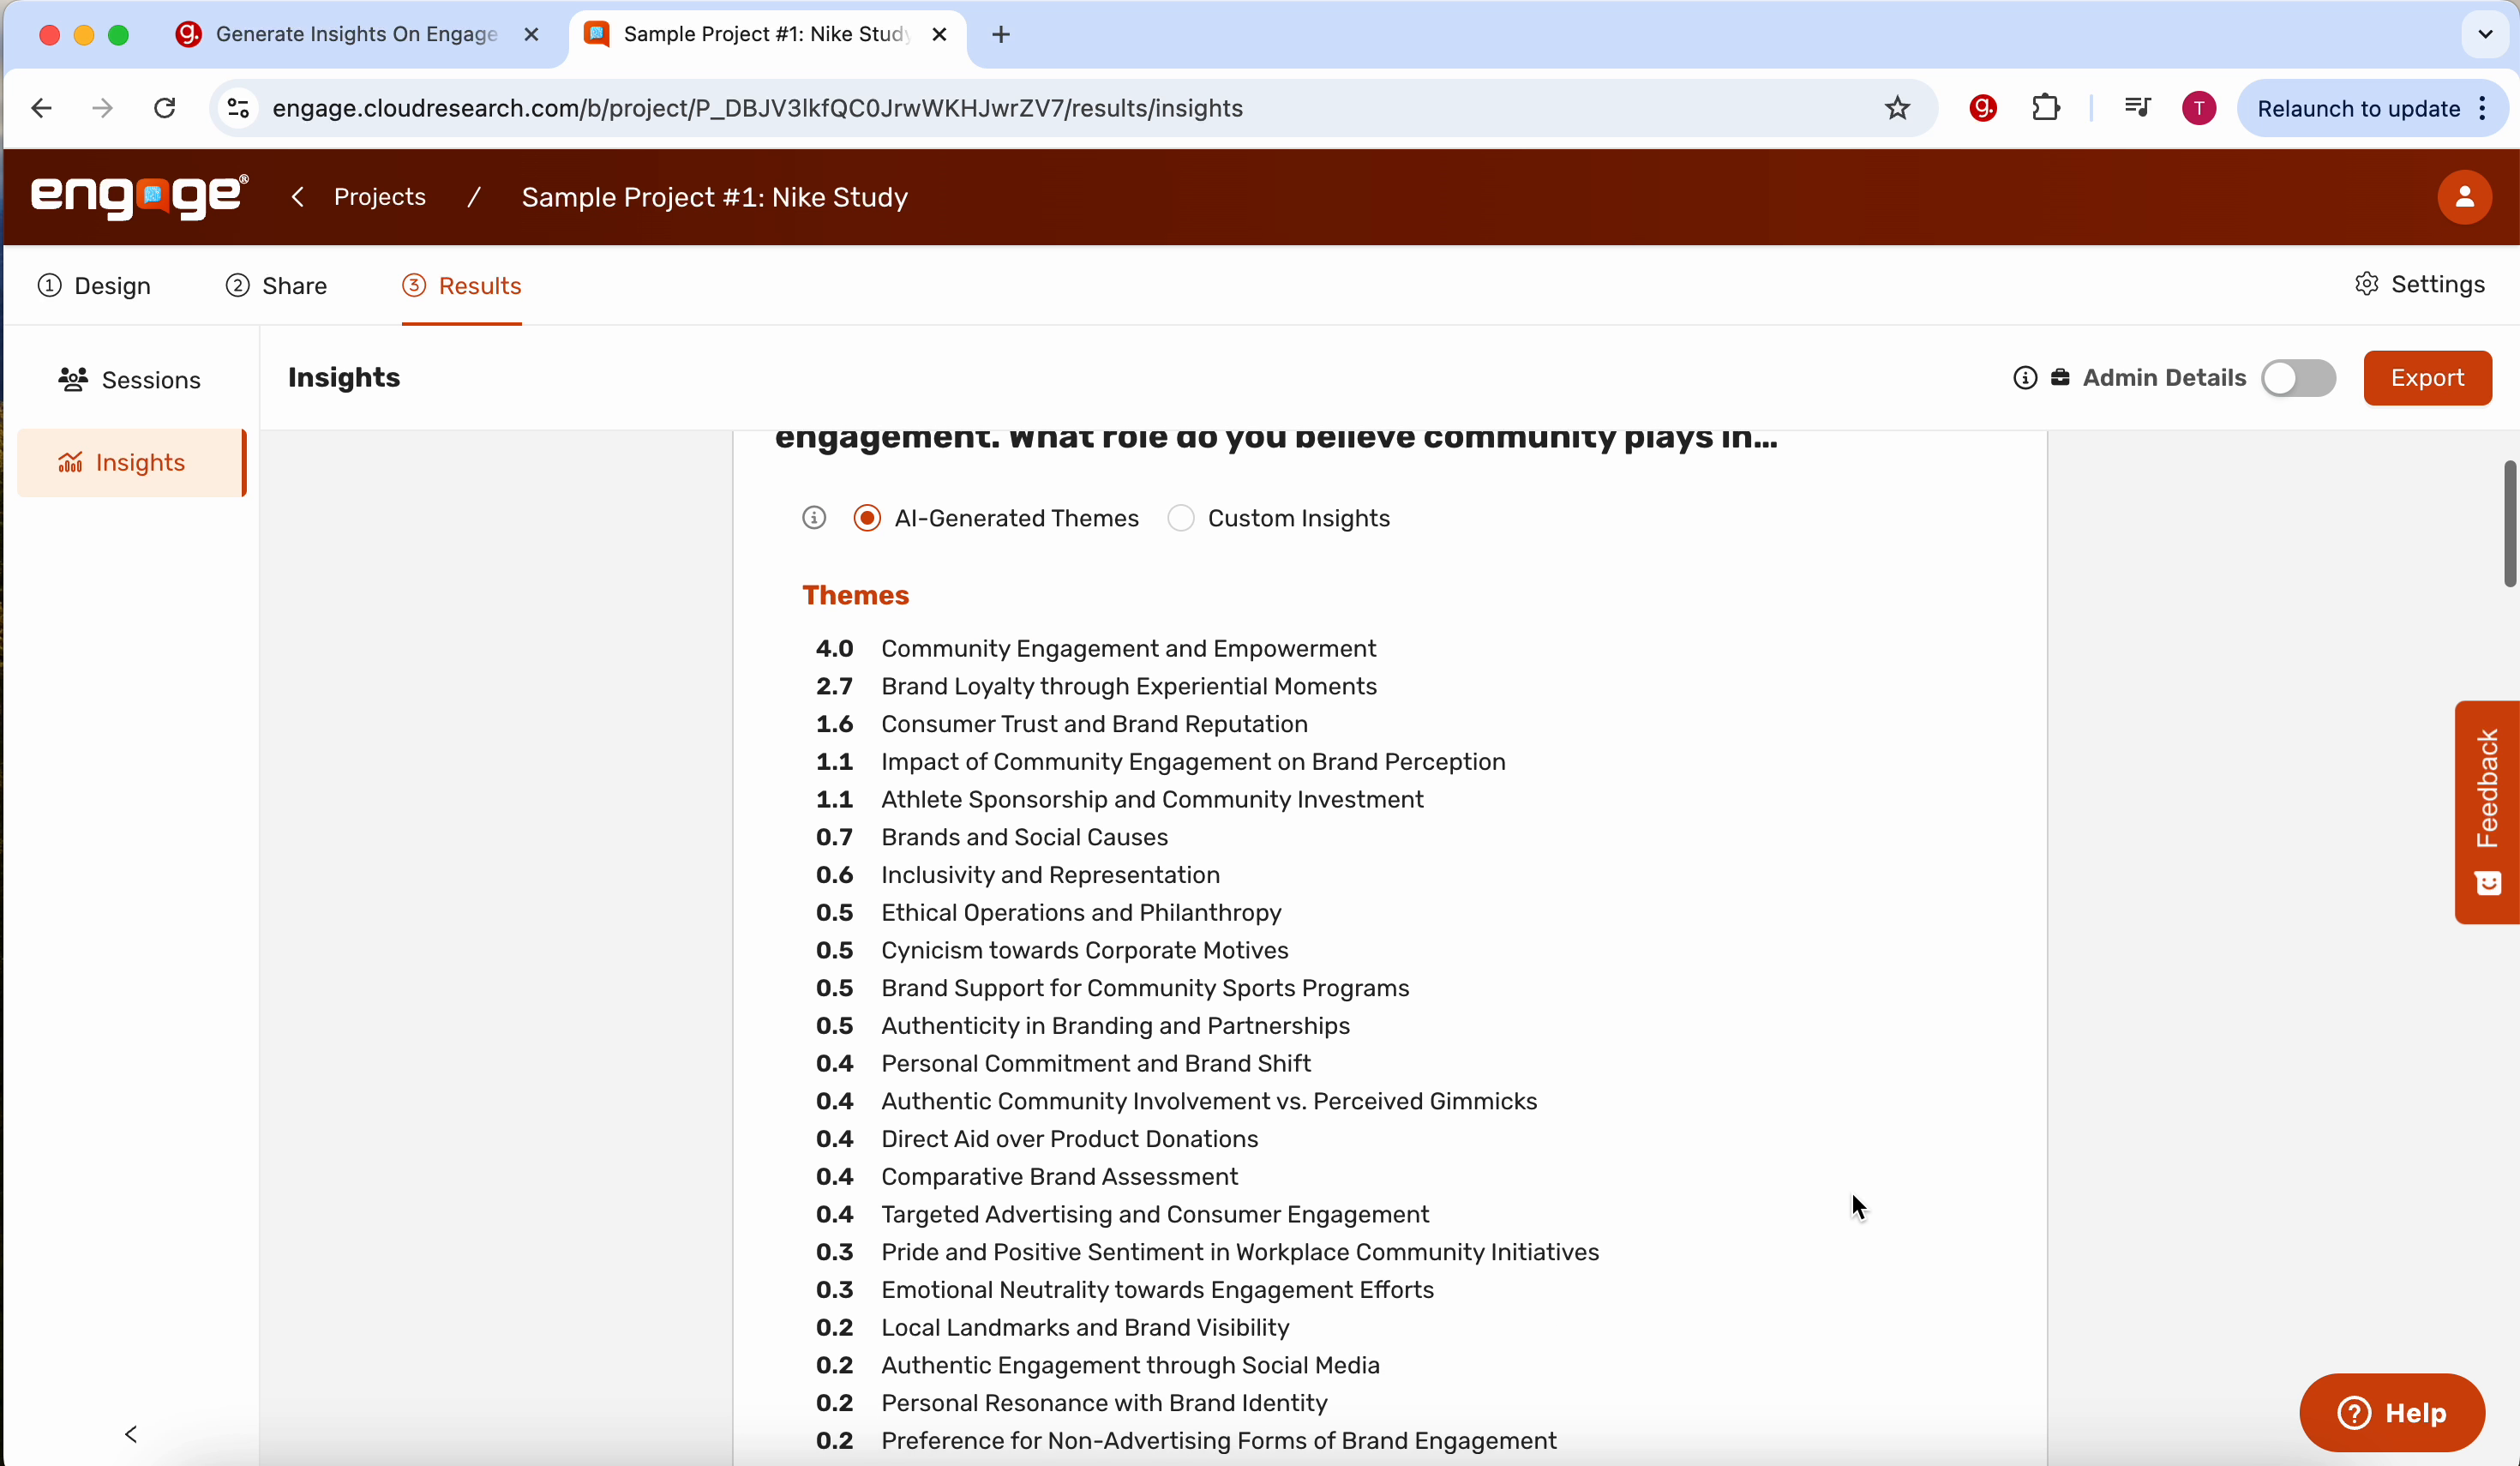
7. View AI Generated Insights
Once the analysis is complete, explore the generated insights to understand the participants' conversations, thoughts, and feelings in-depth without manually reading through all transcripts.
8. Choose Custom Insights
For more tailored analysis, select the custom insights option to run specialized themes or other types of insights.
9. Initiate Insight Generation
Click on "Generate Insights" to begin the process.
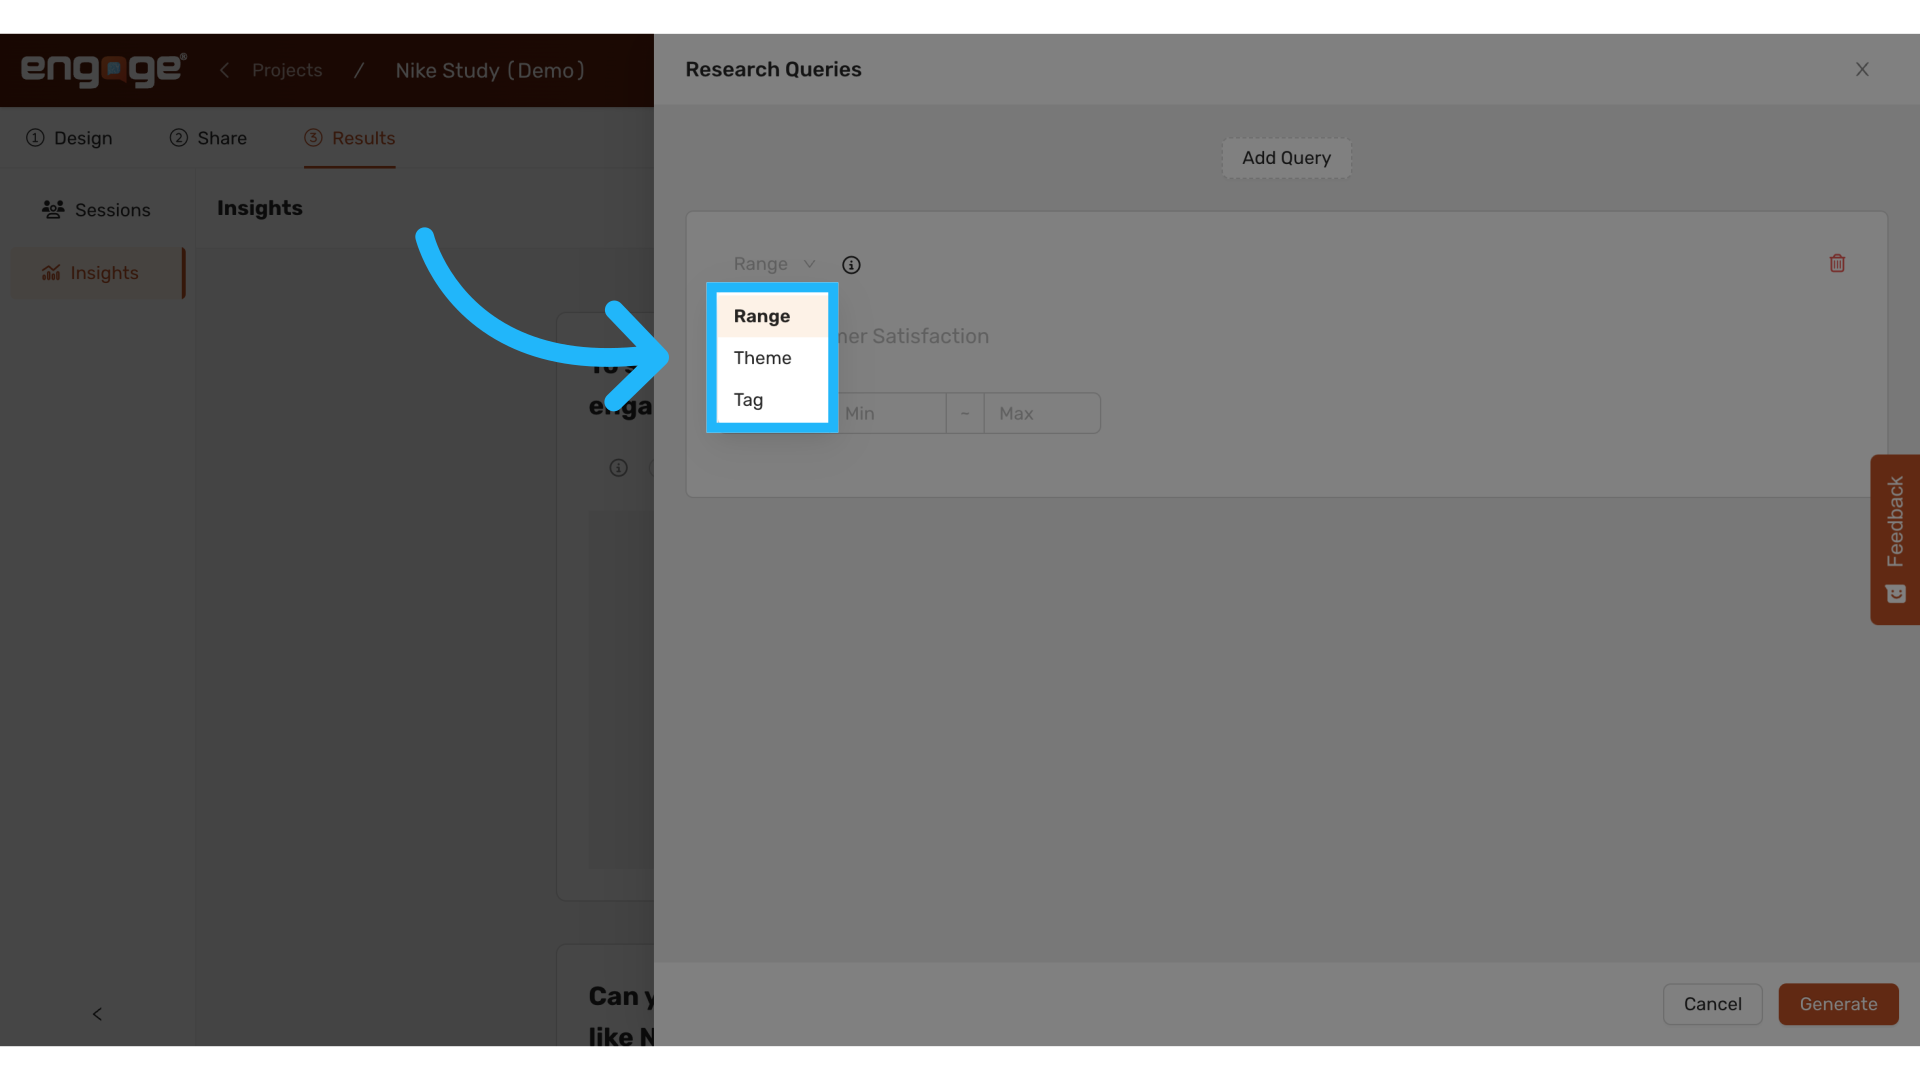
10. Choose the Type of Query
Engage offers three types of insights you can generate: ranges, tags, and themes. These are designed to help identify key patterns and trends within your data.
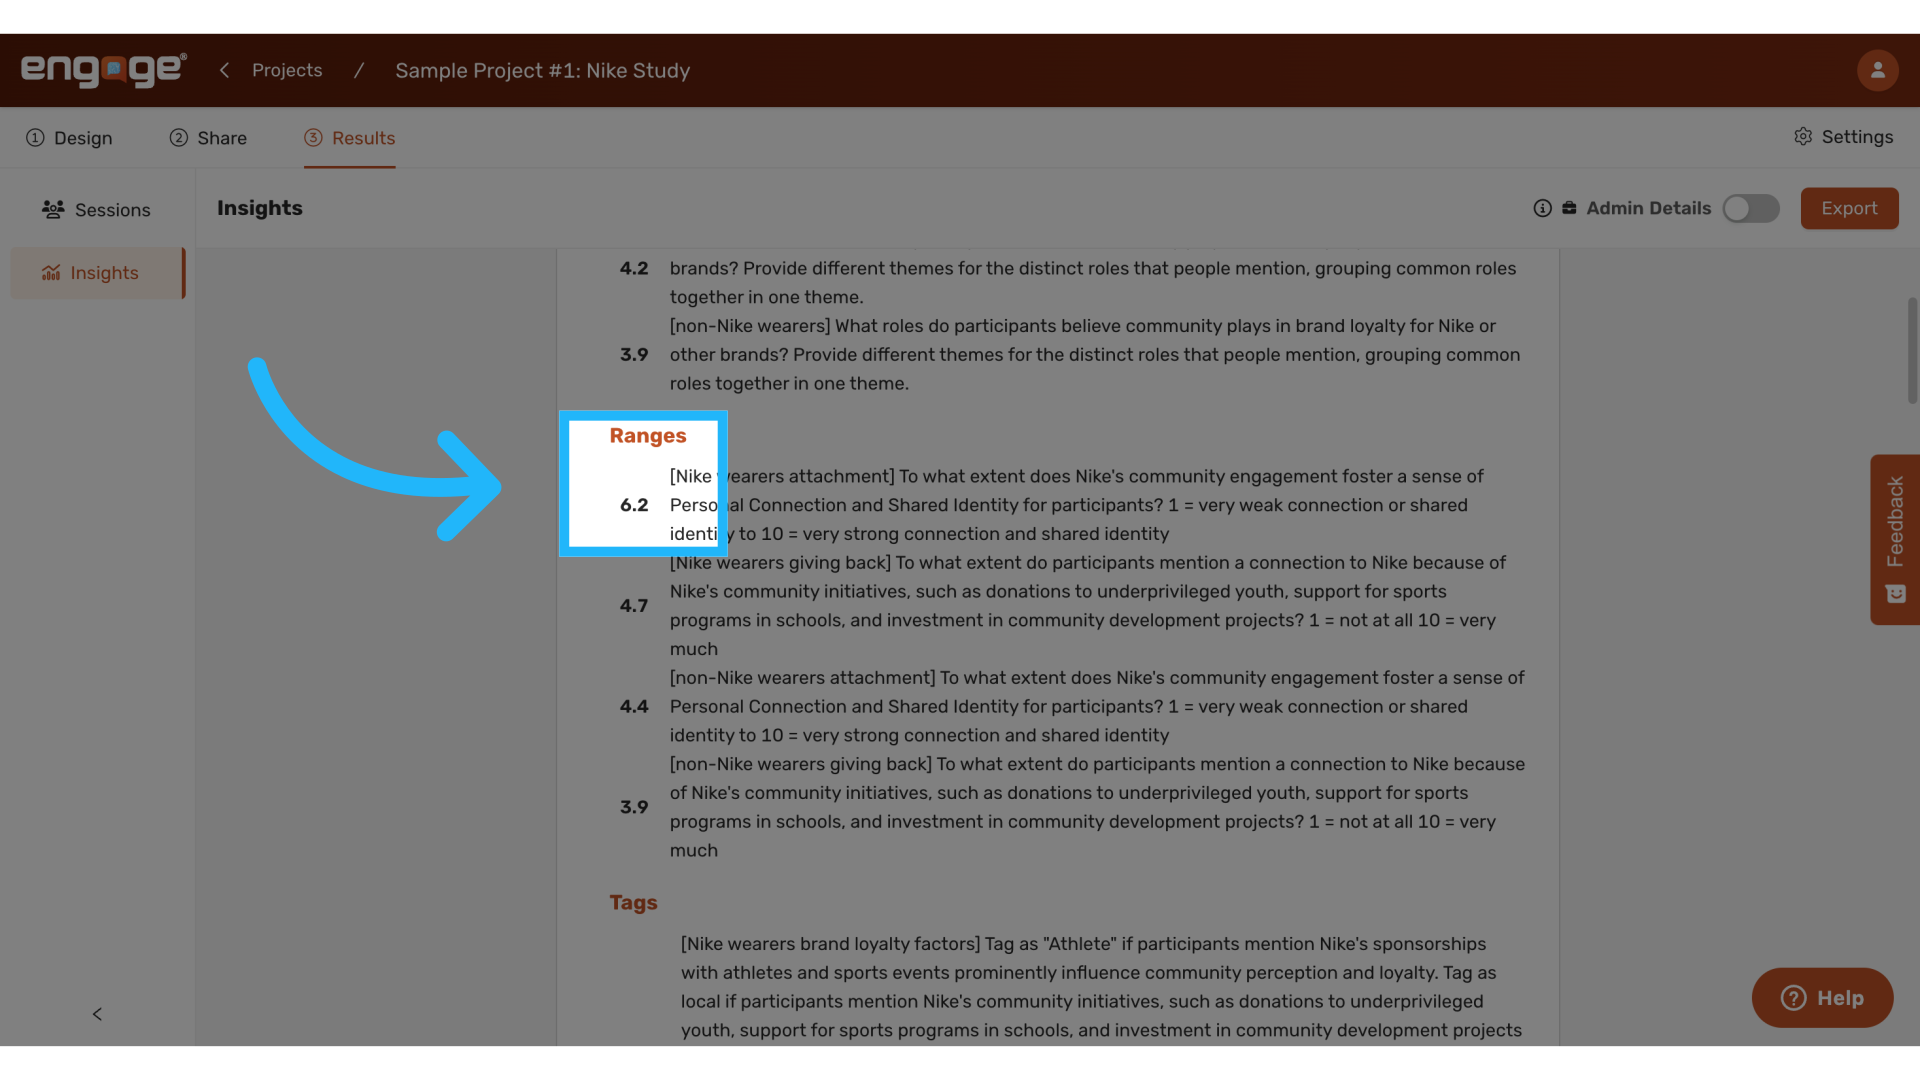
11. Configure Range Queries
Use range queries to measure participants' positions on a specific issue numerically.
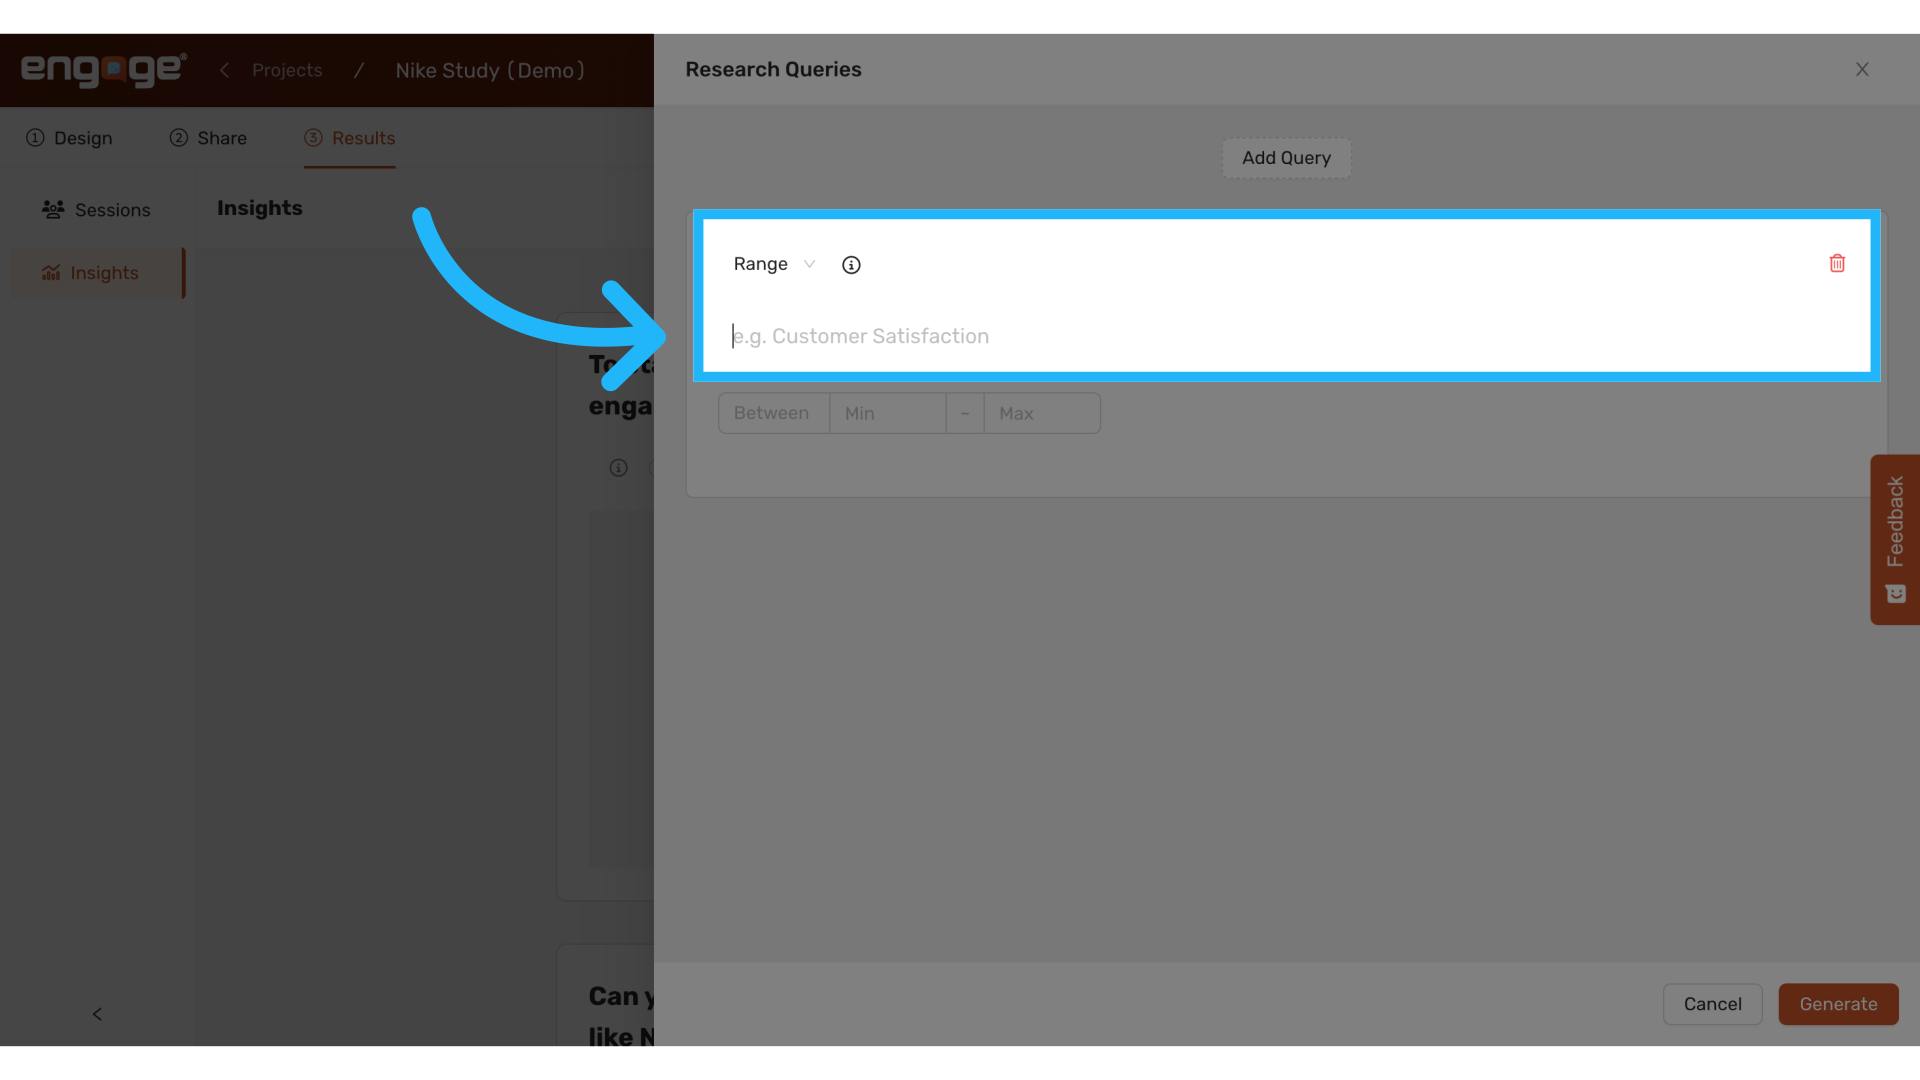
12. Example
For example, to understand how Nike’s community engagement impacts personal connection, specify a range from 1 (very weak) to 10 (very strong).
13. Define Range Limits
Enter the minimum and maximum values for the range you have set.
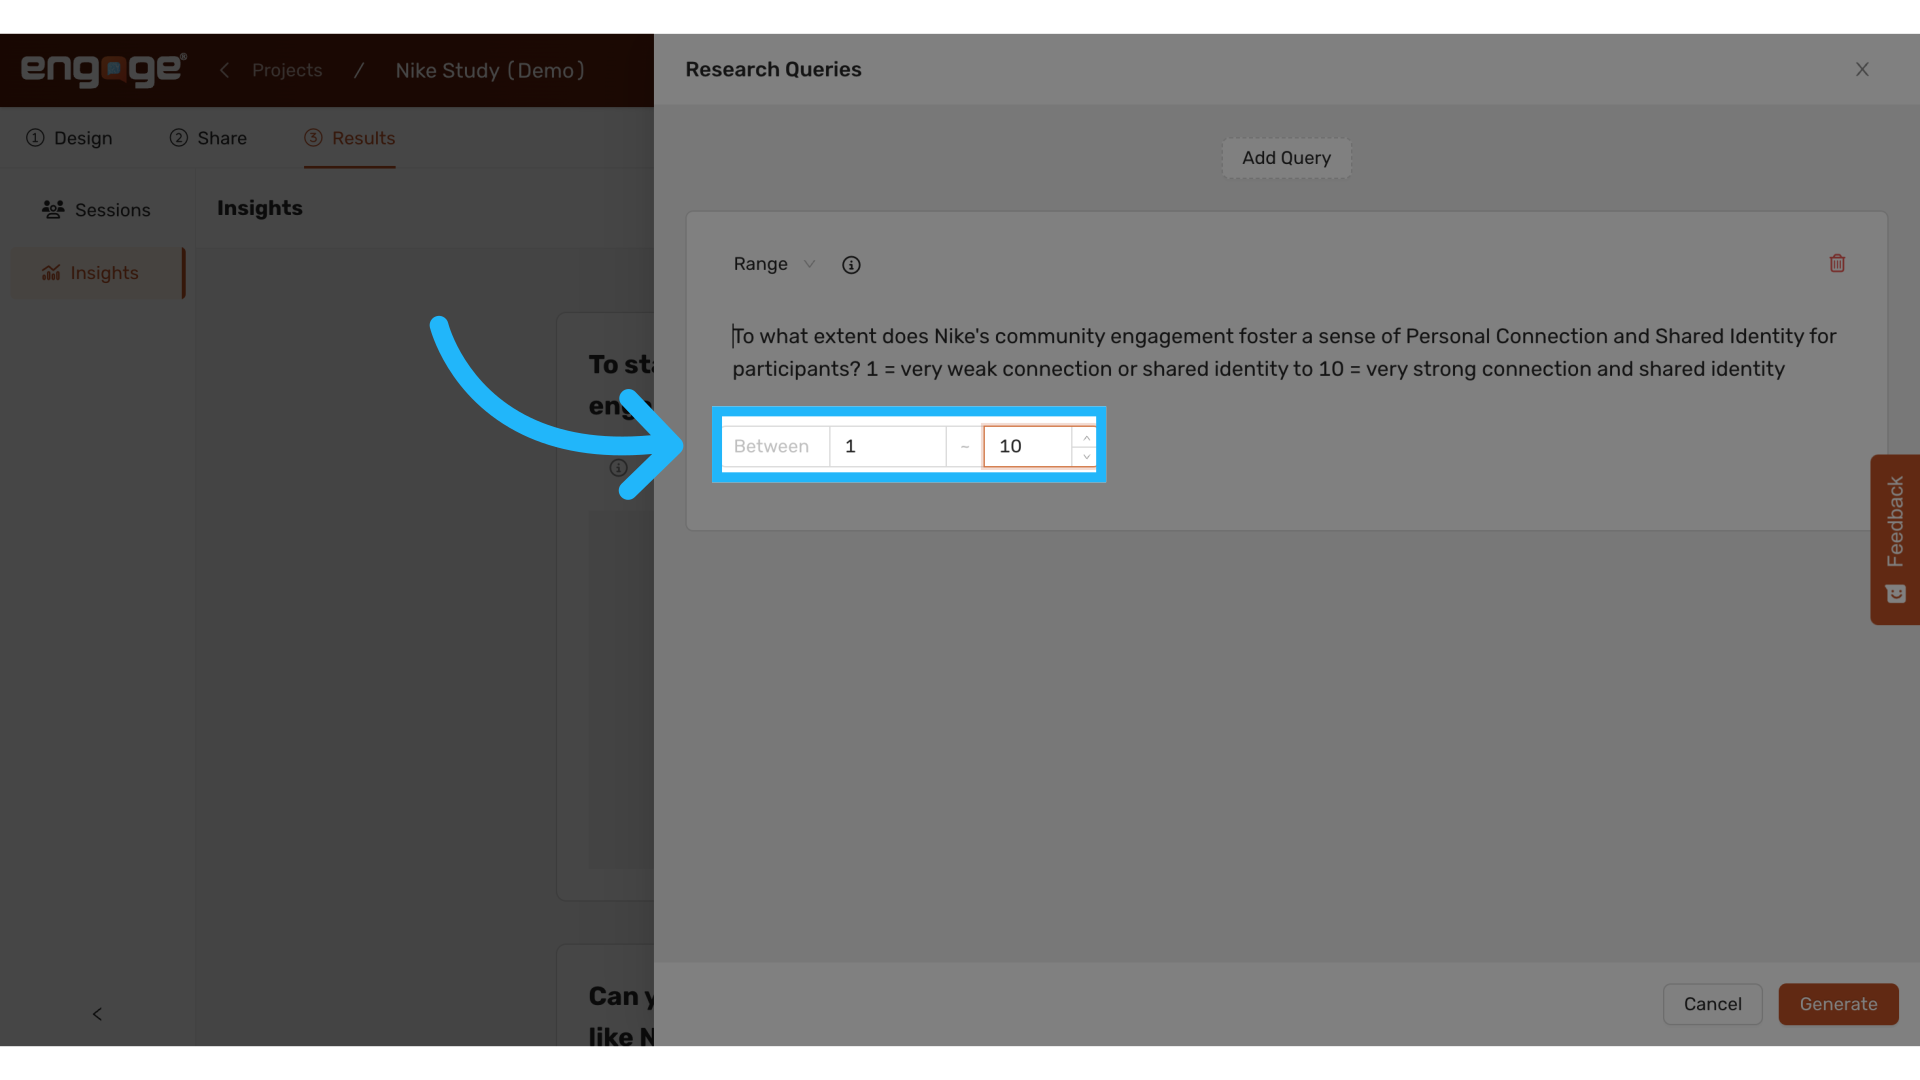
14. Label the Query
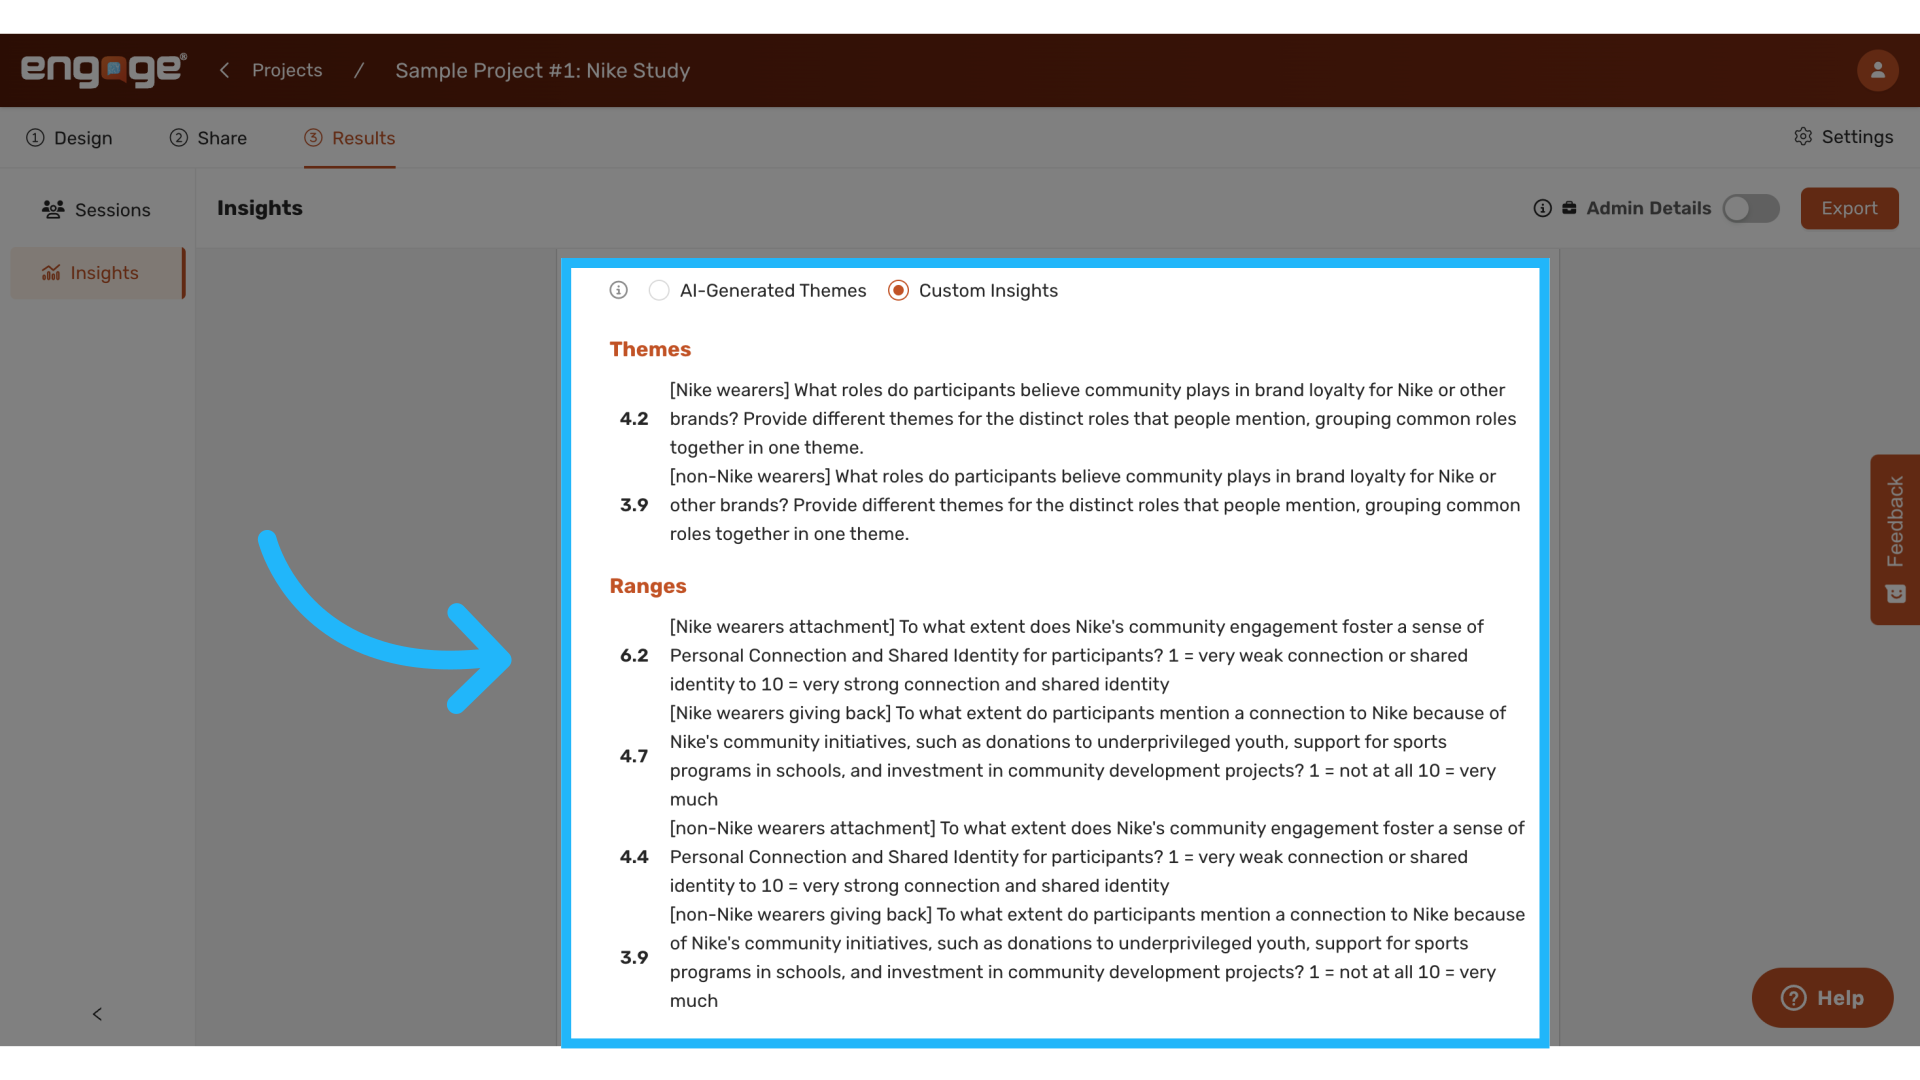
Optionally, use a bracketed title to clarify the focus of each query, such as "[Nike Wearers Attachment] To what extent does Nike's community engagement foster a sense of personal connection and shared identity for participants? 1 = very weak connection to 10 = very strong connection."
![Fill '[Nike Wearers attachment] To what extent does Nike's community engagement foster a sense of Personal Connection and Shared Identity for participants? 1 = very weak connection or shared identity to 10 = very strong connection and shared identity'](https://static.guidde.com/v0/qg%2Fw78aSaVdIiNF5cJzAlAu08uk1eu2%2F5yG6x2TRW68yHLEzNVDu3g%2Fa869bYdmhmrJq9xoNZvp6Q_doc.png?alt=media&token=a82a7001-2acc-4416-9398-30d952cb8d6a)
15. Add Another Insights Query
After setting up your initial queries, you might want to explore more aspects of your data. Click on "Add Query" to incorporate additional insights into your analysis.

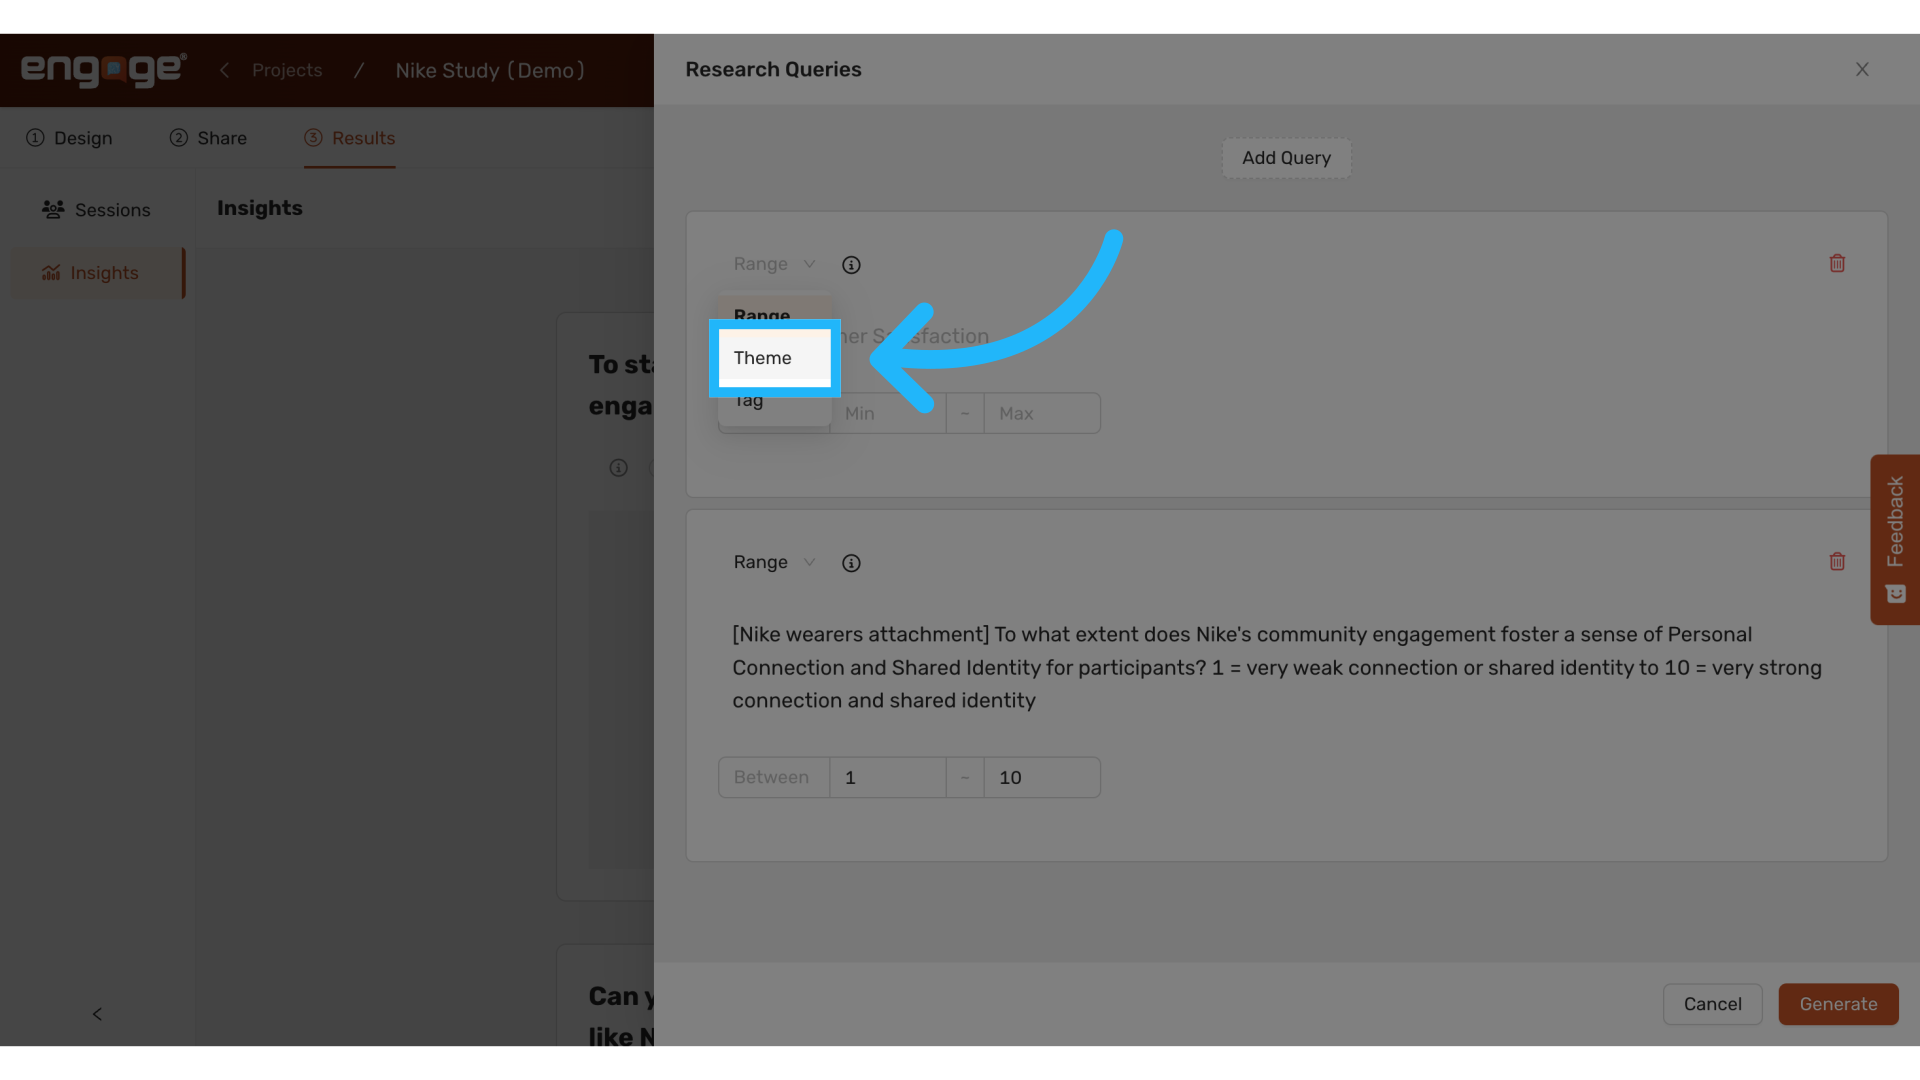
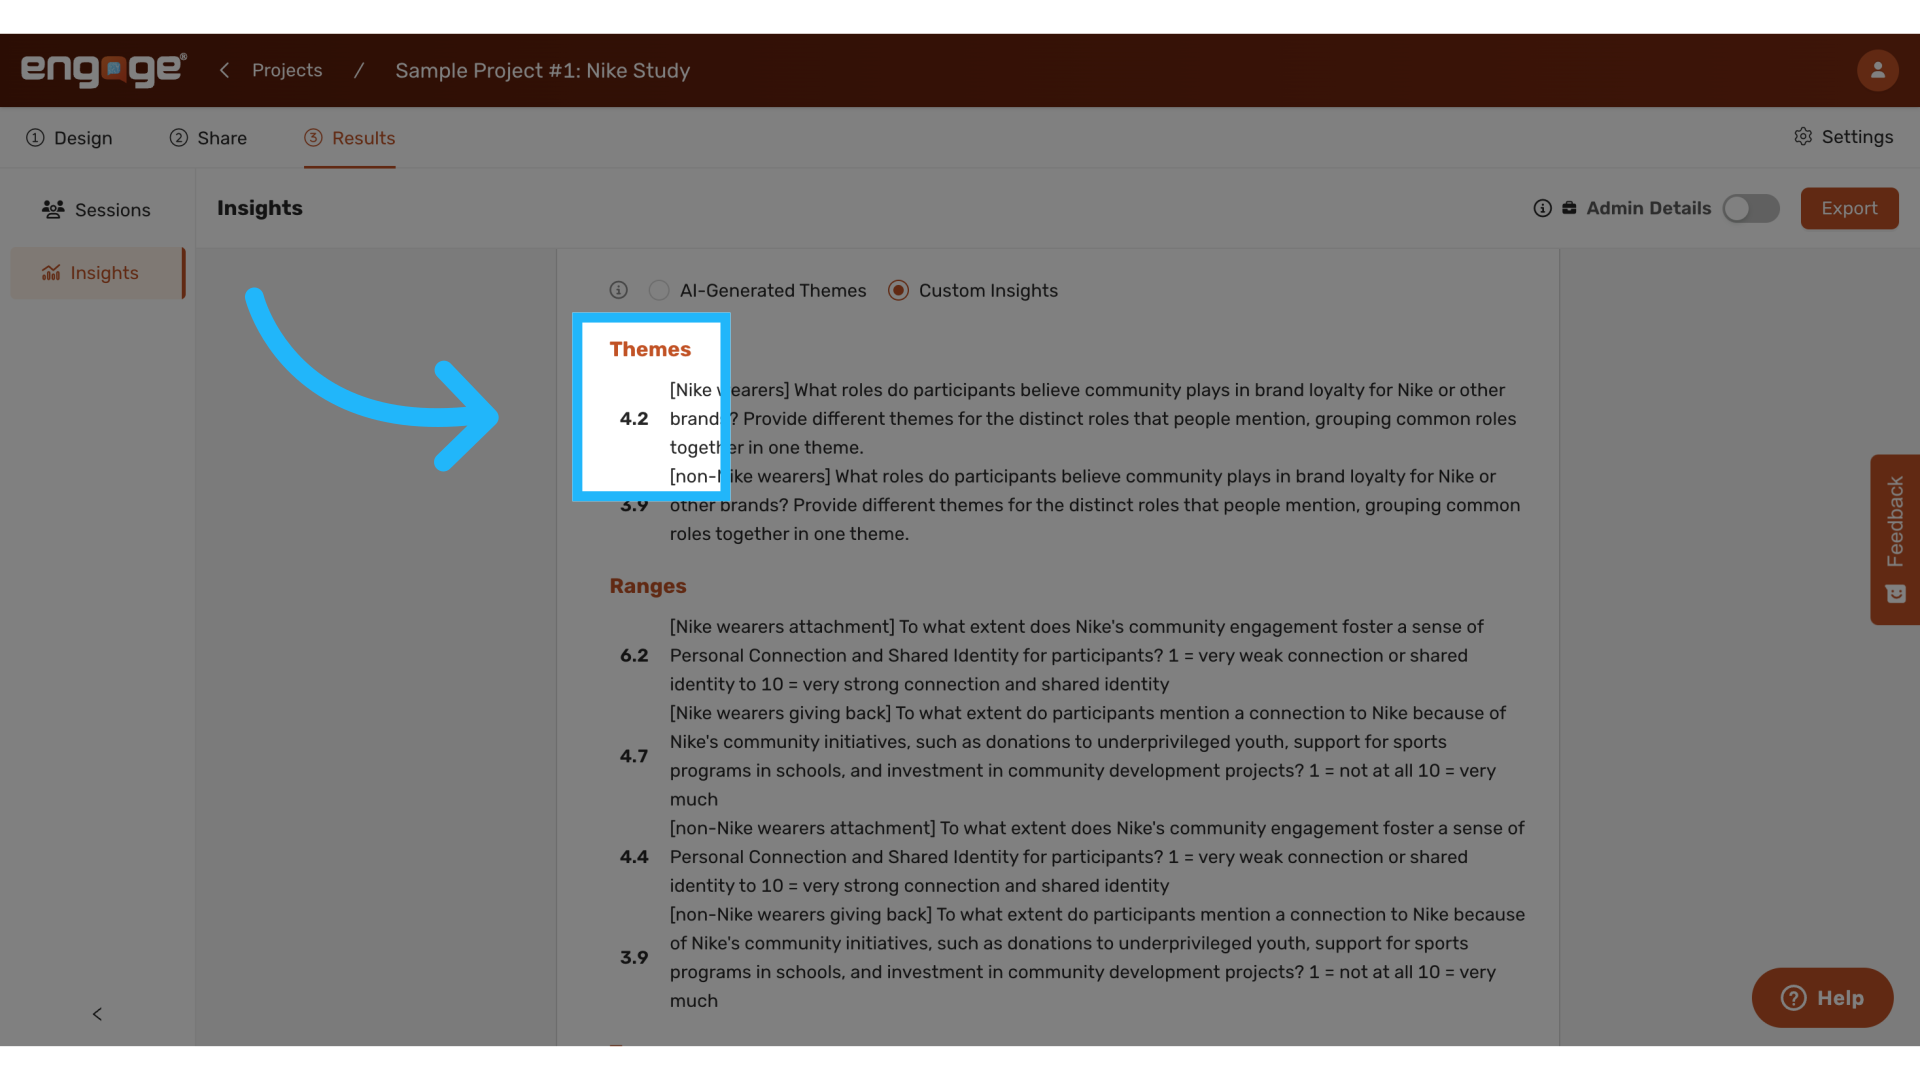
16. Select Theme Query Type
A new query box will appear, allowing you to select the type of query. For thematic analysis, choose the "Theme Query Type" to enable AI to identify and categorize themes within your data.
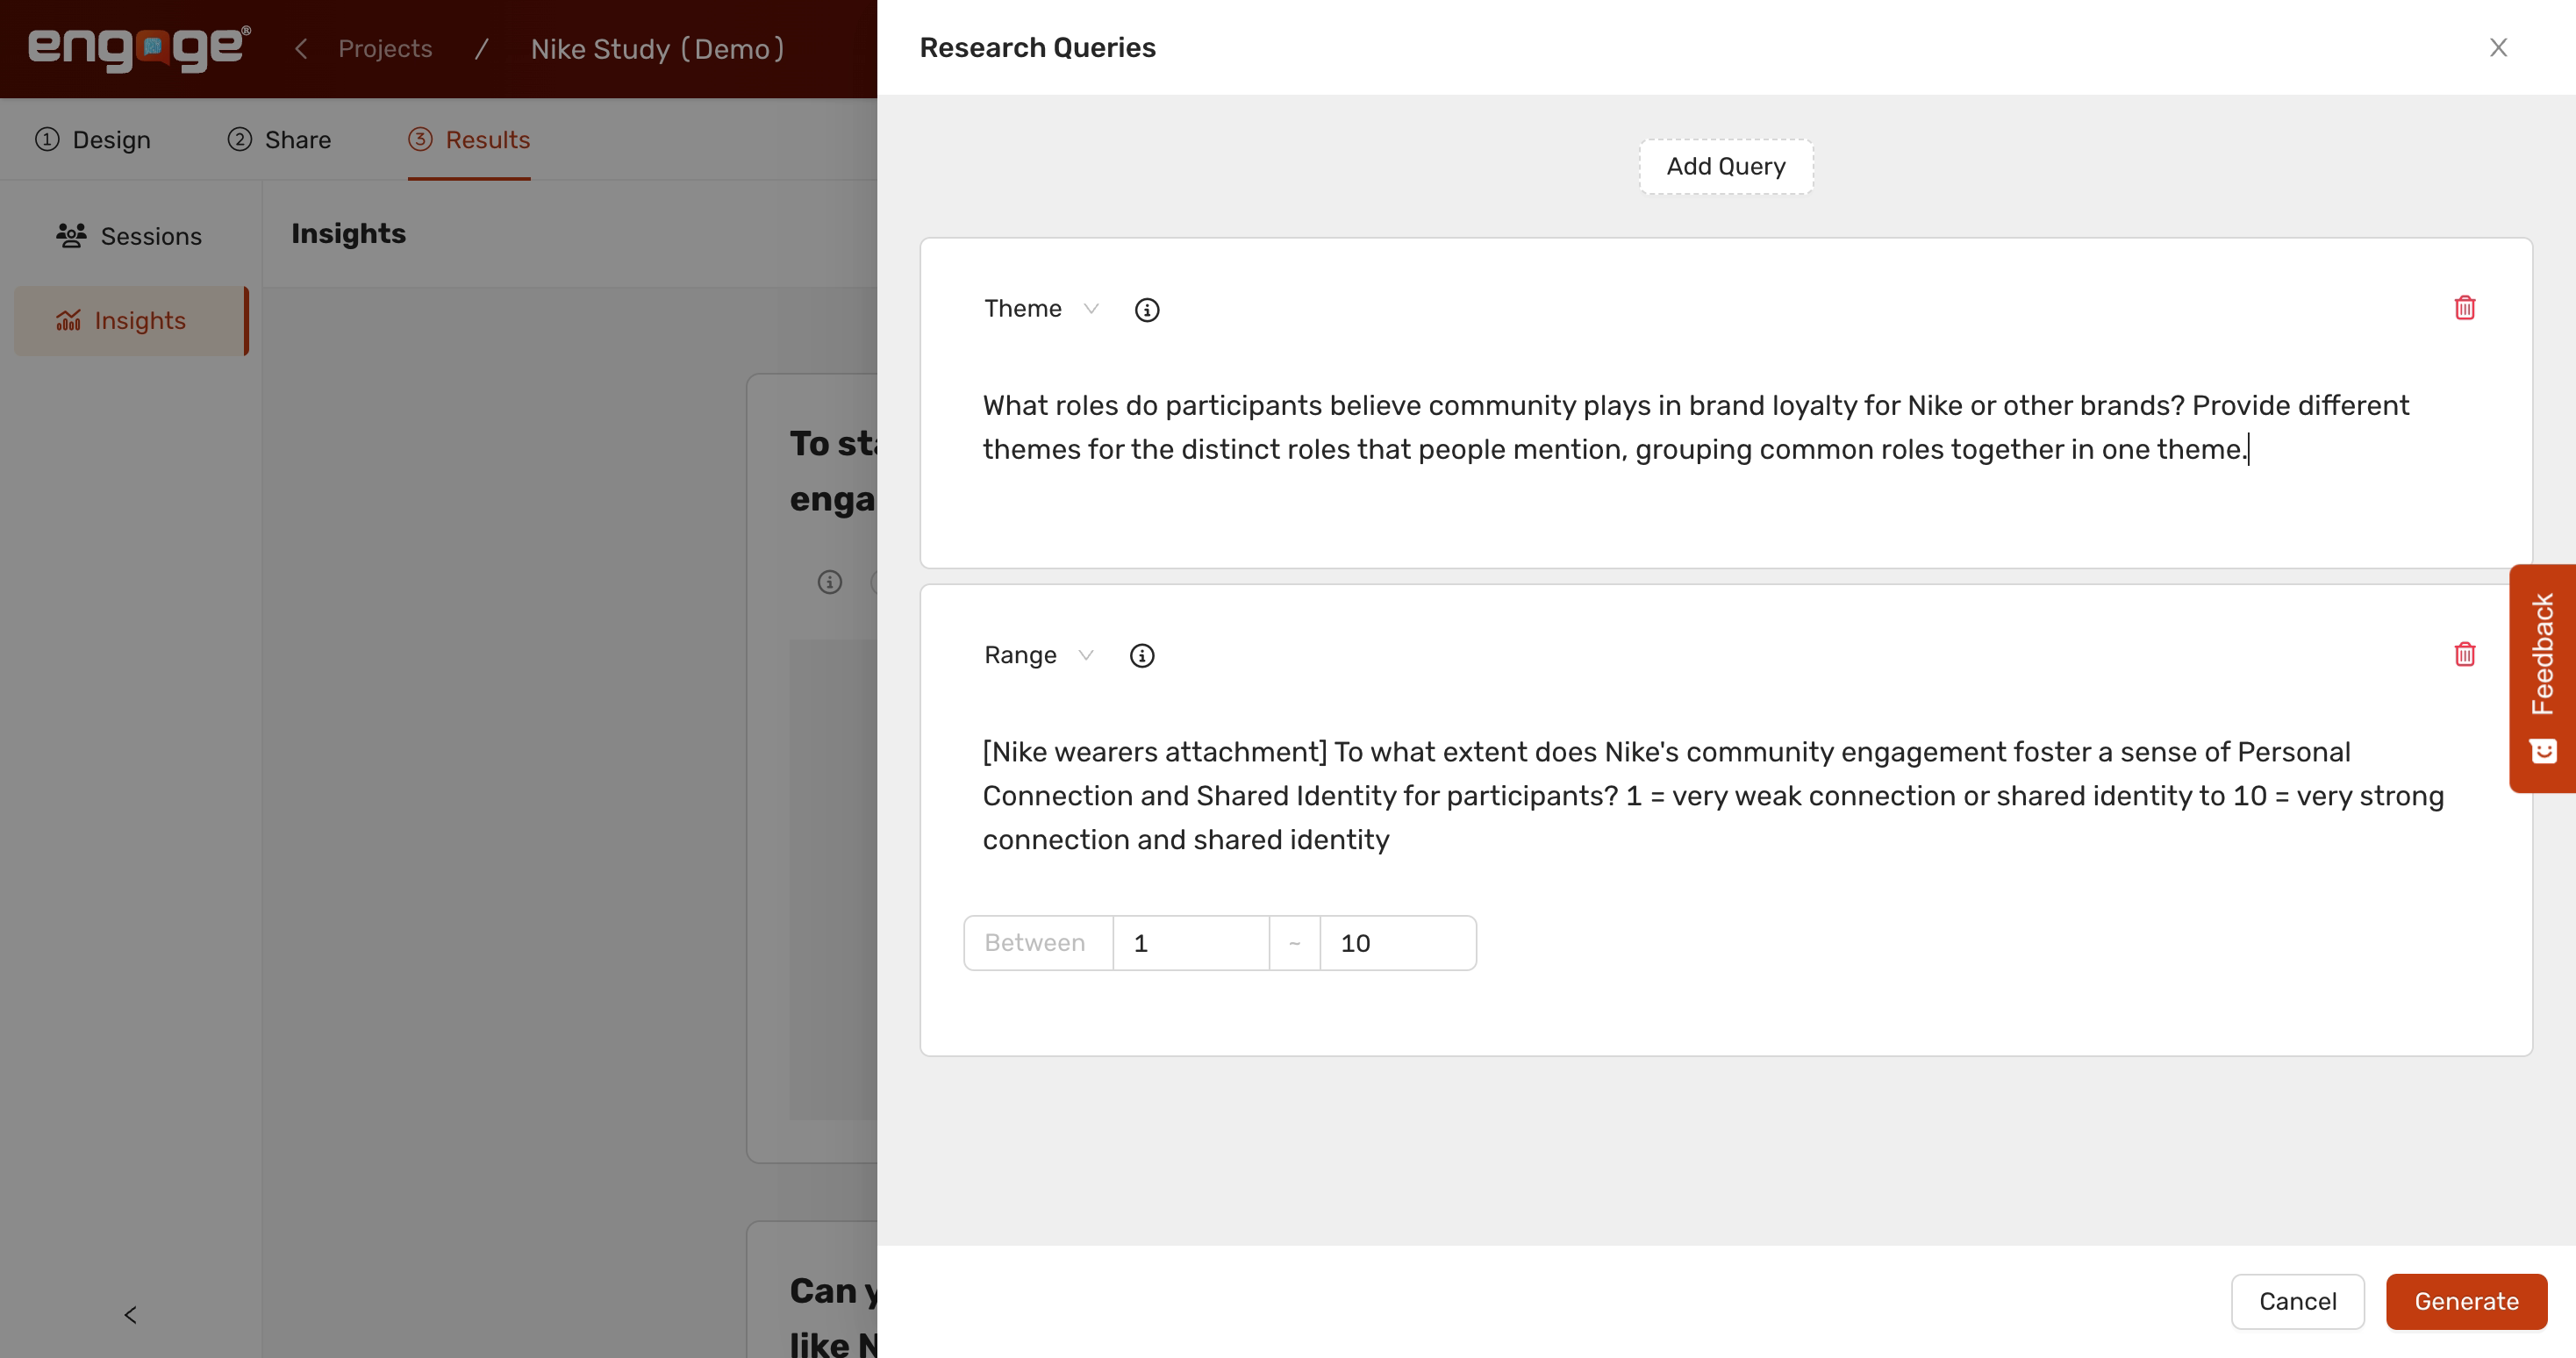
17. Enter Theme Query
Specify what themes AI should look for, such as analyzing the roles participants believe community engagement plays in brand loyalty for brands like Nike. This helps group common roles into distinct themes.
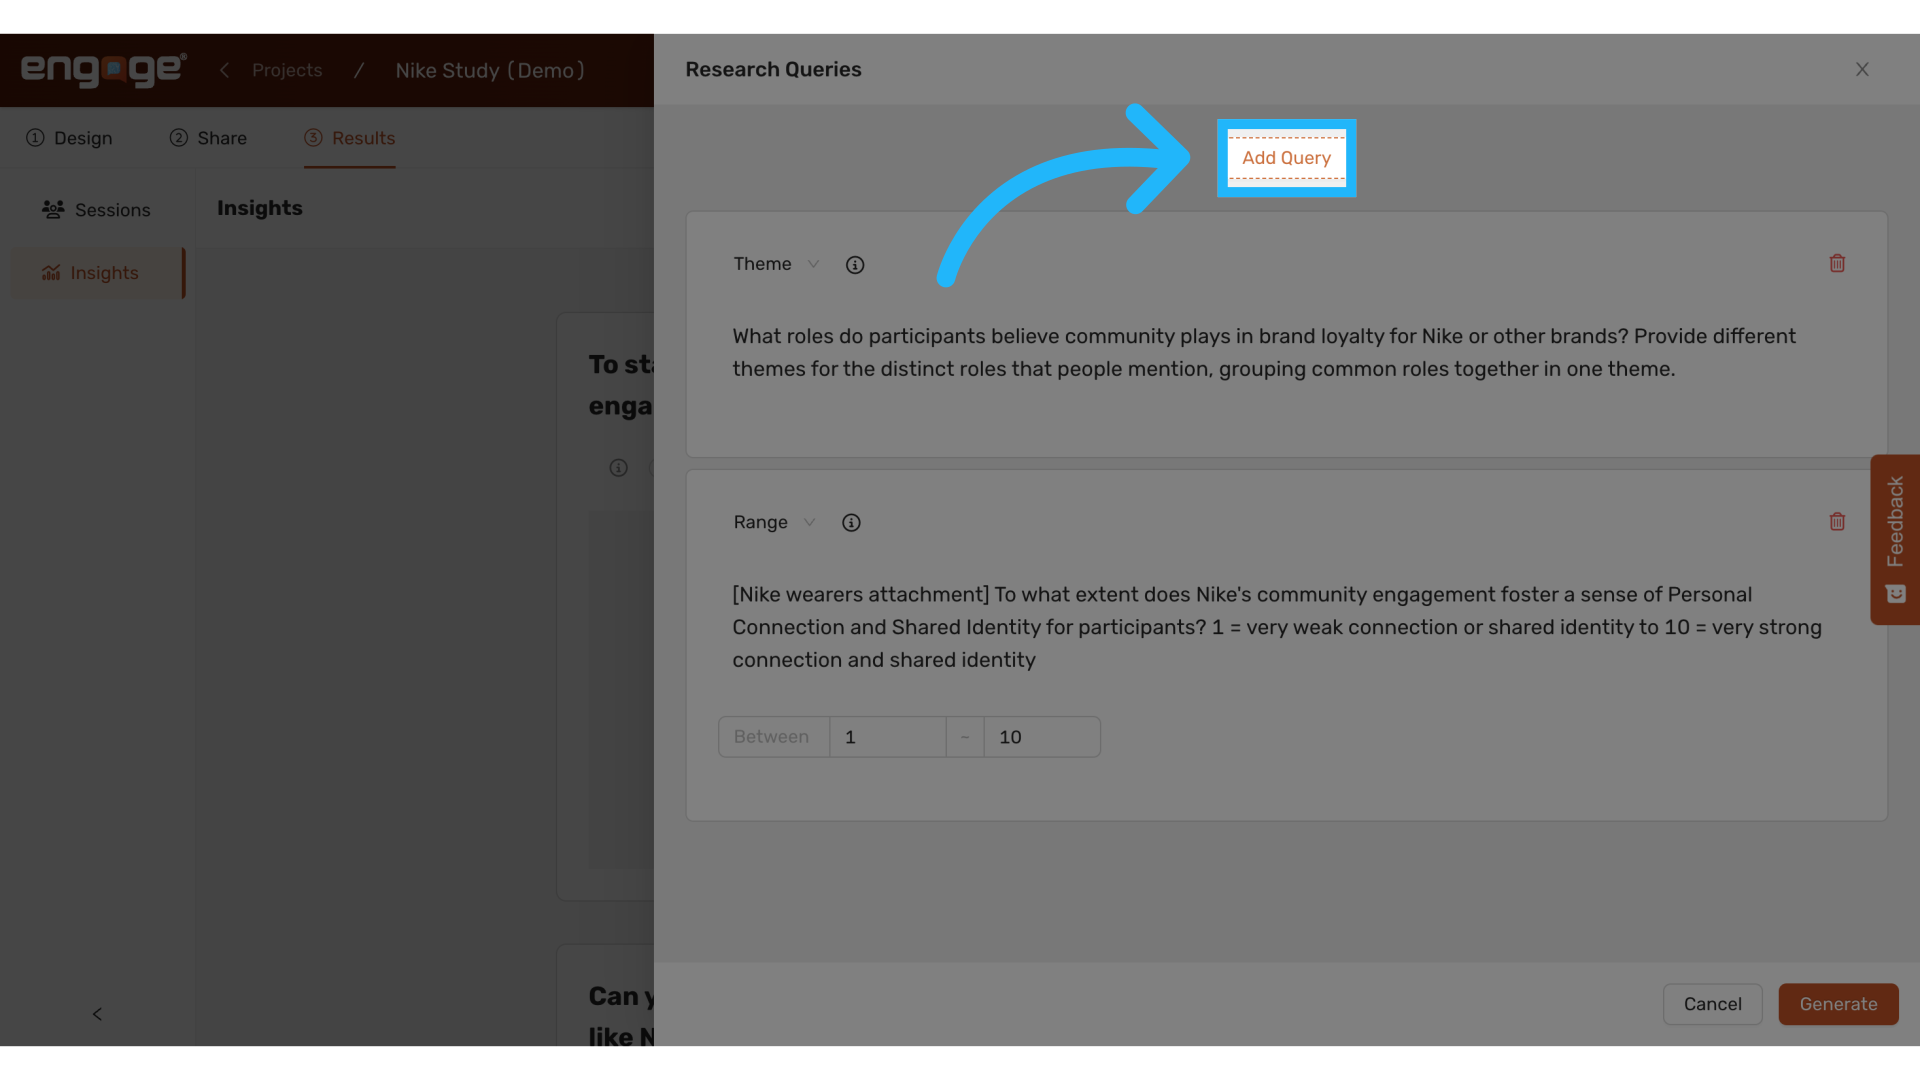
18. Add Query
If further insights are needed, continue adding queries. This flexibility allows for a broader exploration of your dataset.
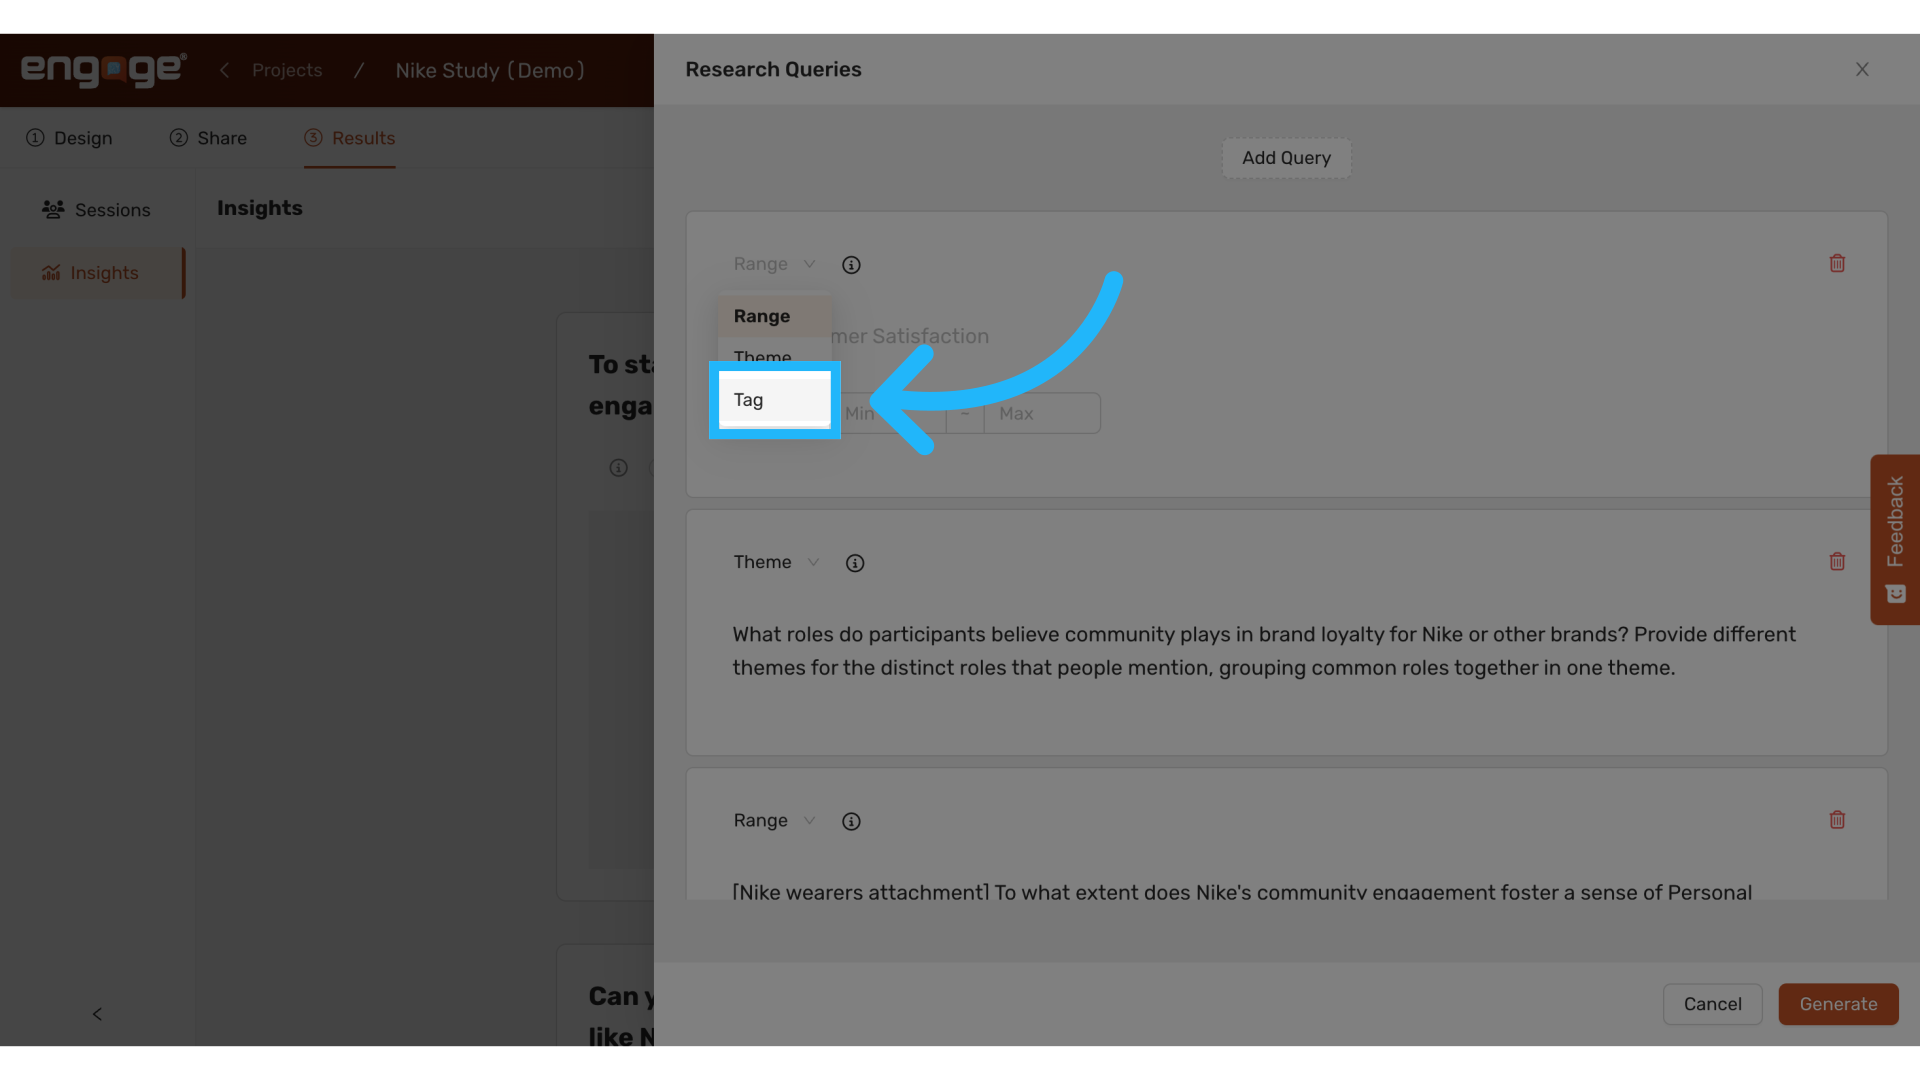
19. Select Tag Query Type
For more granular insights, select the "Tag Query Type." This option lets you tag data points with specific labels based on predefined criteria, enriching your analytical depth.
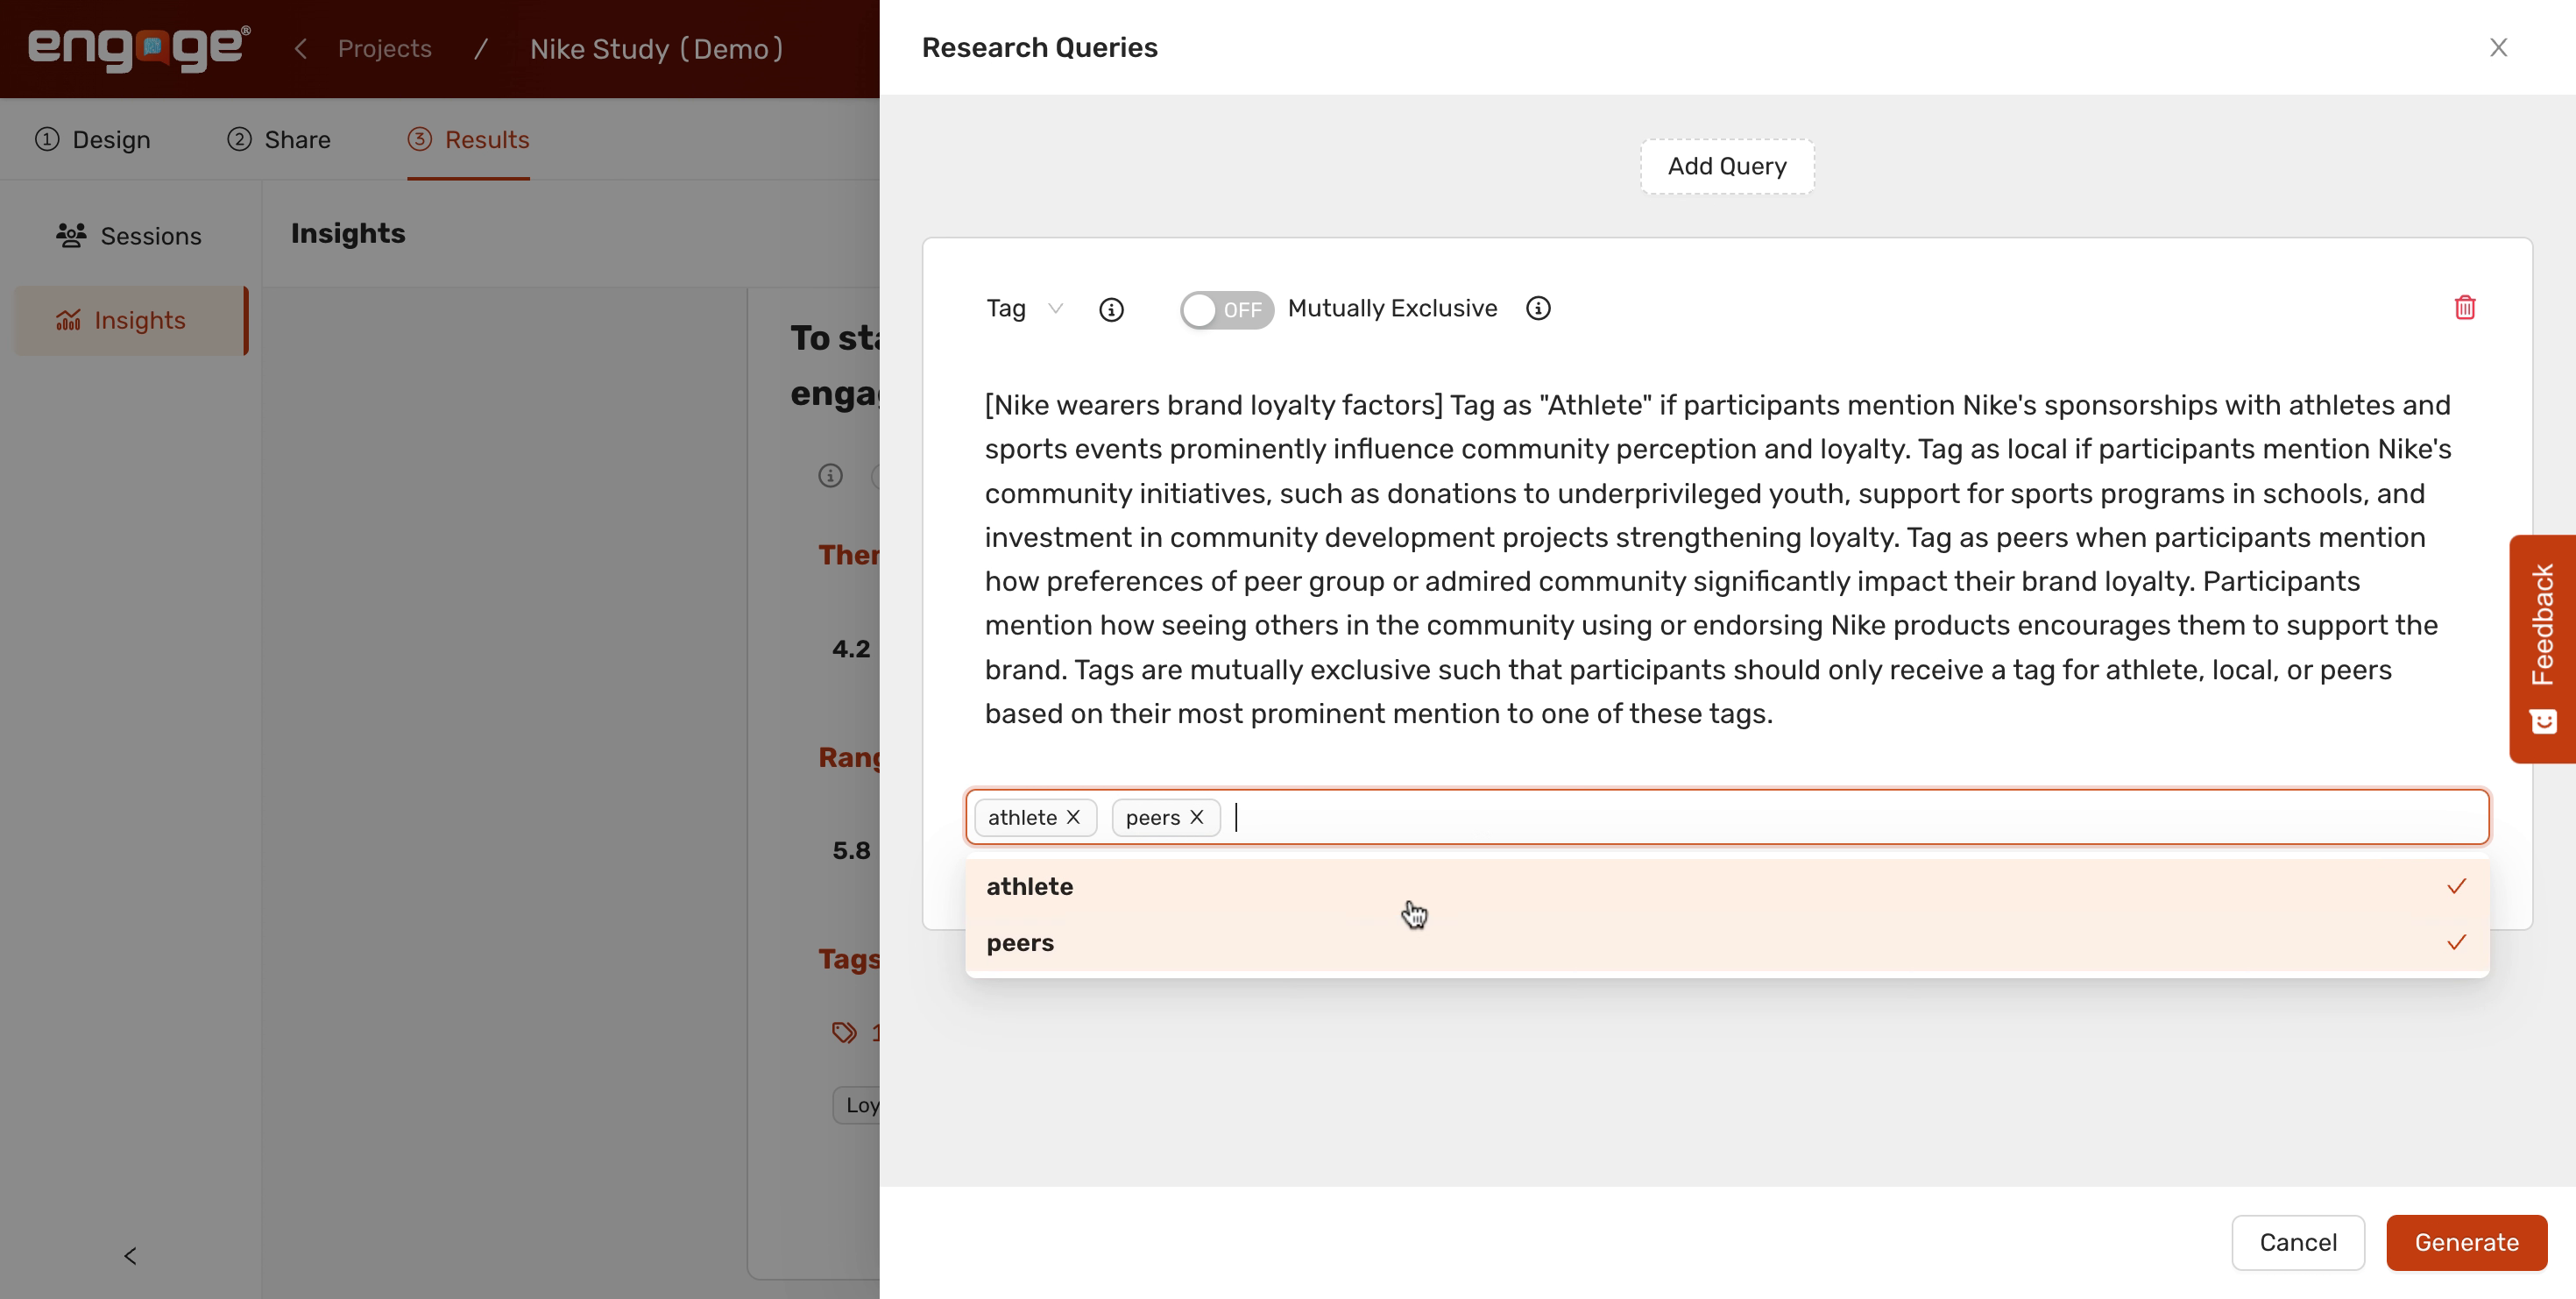
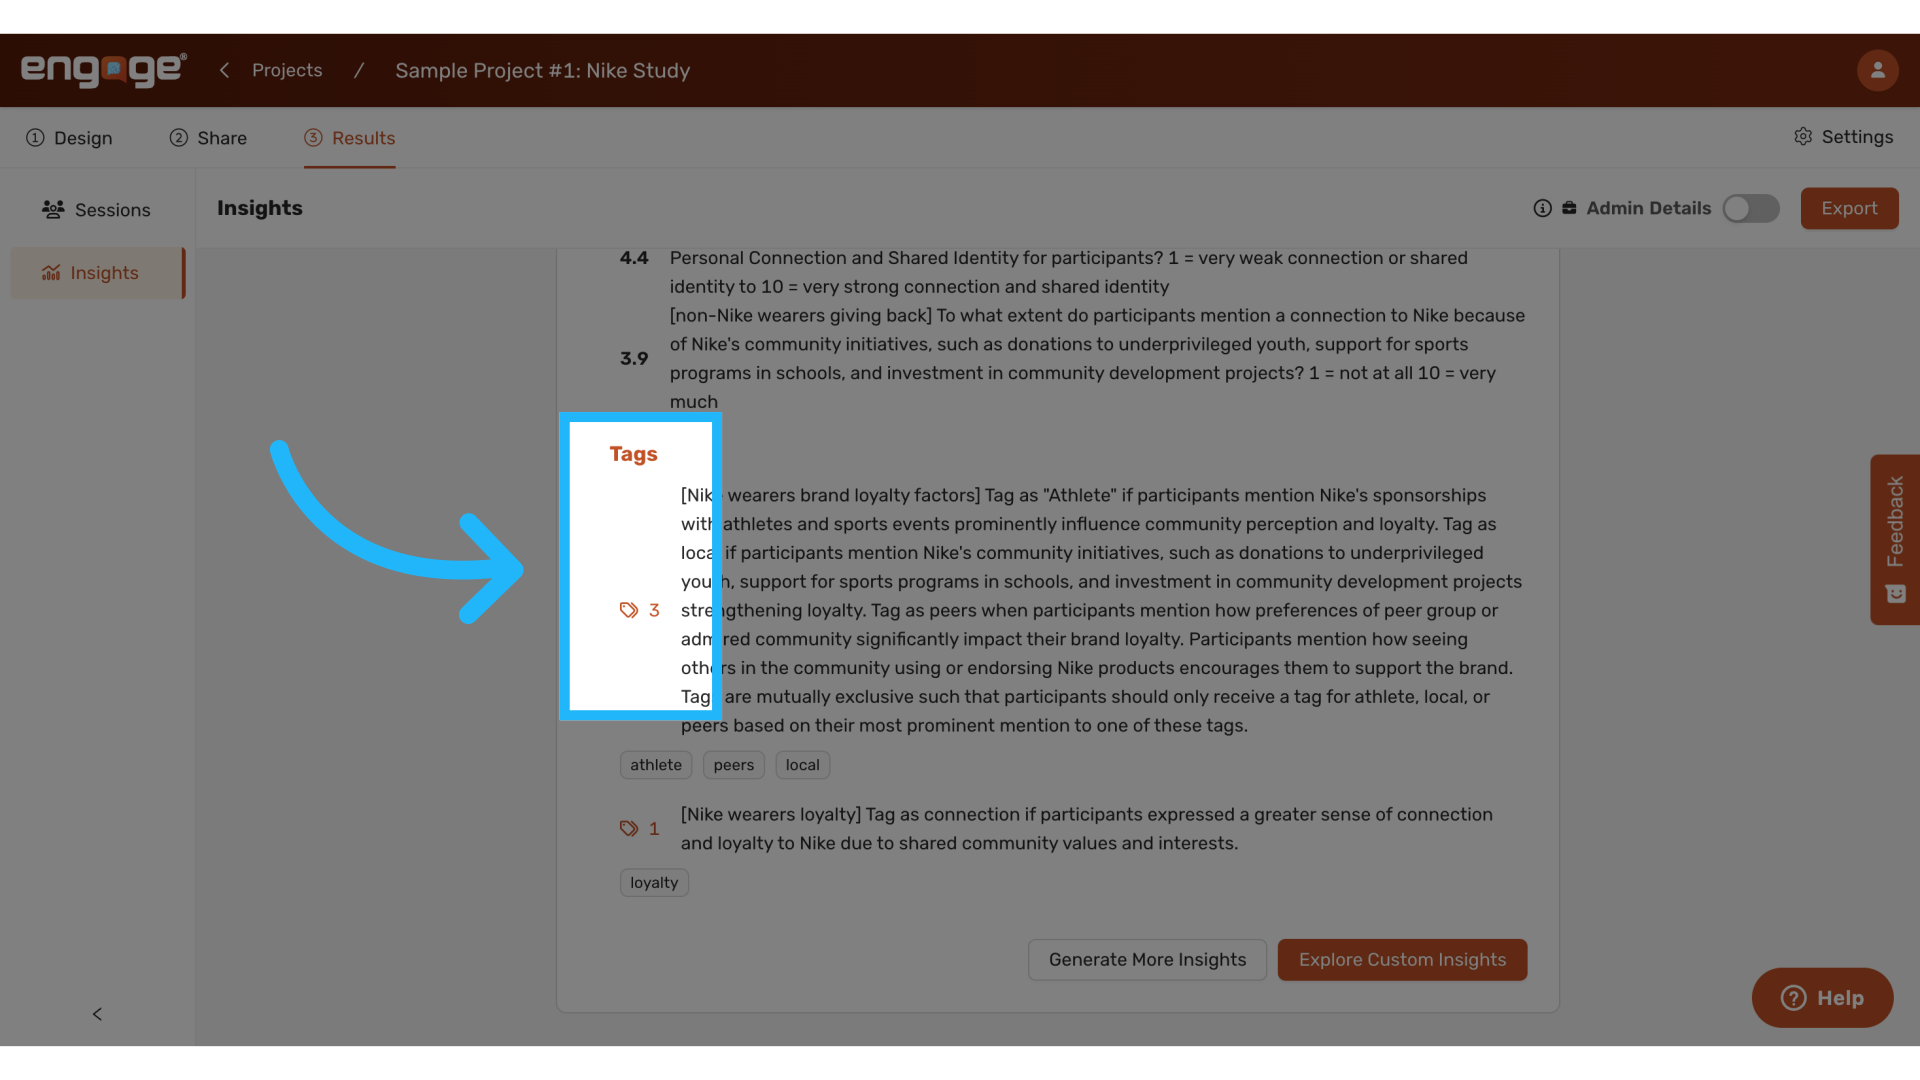
20. Define Tags
Define your tags clearly. For example, you can ask AI to assign "athlete", "local", or "peers" tags based on participants responses athlete for mentions of Nikes, athletes sponsorships, local for Community initiatives and peers for peer group influence on brand loyalty,
![Fill '[Nike wearers brand loyalty factors] Tag as 'Athlete' if participants mention Nike's sponsorships with athletes and sports events prominently influence community perception and loyalty. Tag as local if participants mention Nike's community initiatives, such as donations to underprivileged youth, support for sports programs in schools, and investment in community development projects strengthening loyalty. Tag as peers when participants mention how preferences of peer group or admired community significantly impact their brand loyalty. Participants mention how seeing others in the community using or endorsing Nike products encourages them to support the brand. Tags are mutually exclusive such that participants should only receive a tag for athlete, local, or peers based on their most prominent mention to one of these tags.'](https://static.guidde.com/v0/qg%2Fw78aSaVdIiNF5cJzAlAu08uk1eu2%2F5yG6x2TRW68yHLEzNVDu3g%2F5UTxXYdMydha1kji8yjsqq_doc.png?alt=media&token=0d52a6ca-8eca-4d78-ae47-0afbd2e4ac64)
21. Enter Tags
Specify the unique tags that AI should apply to the data, such as "athlete", "peers", "local".
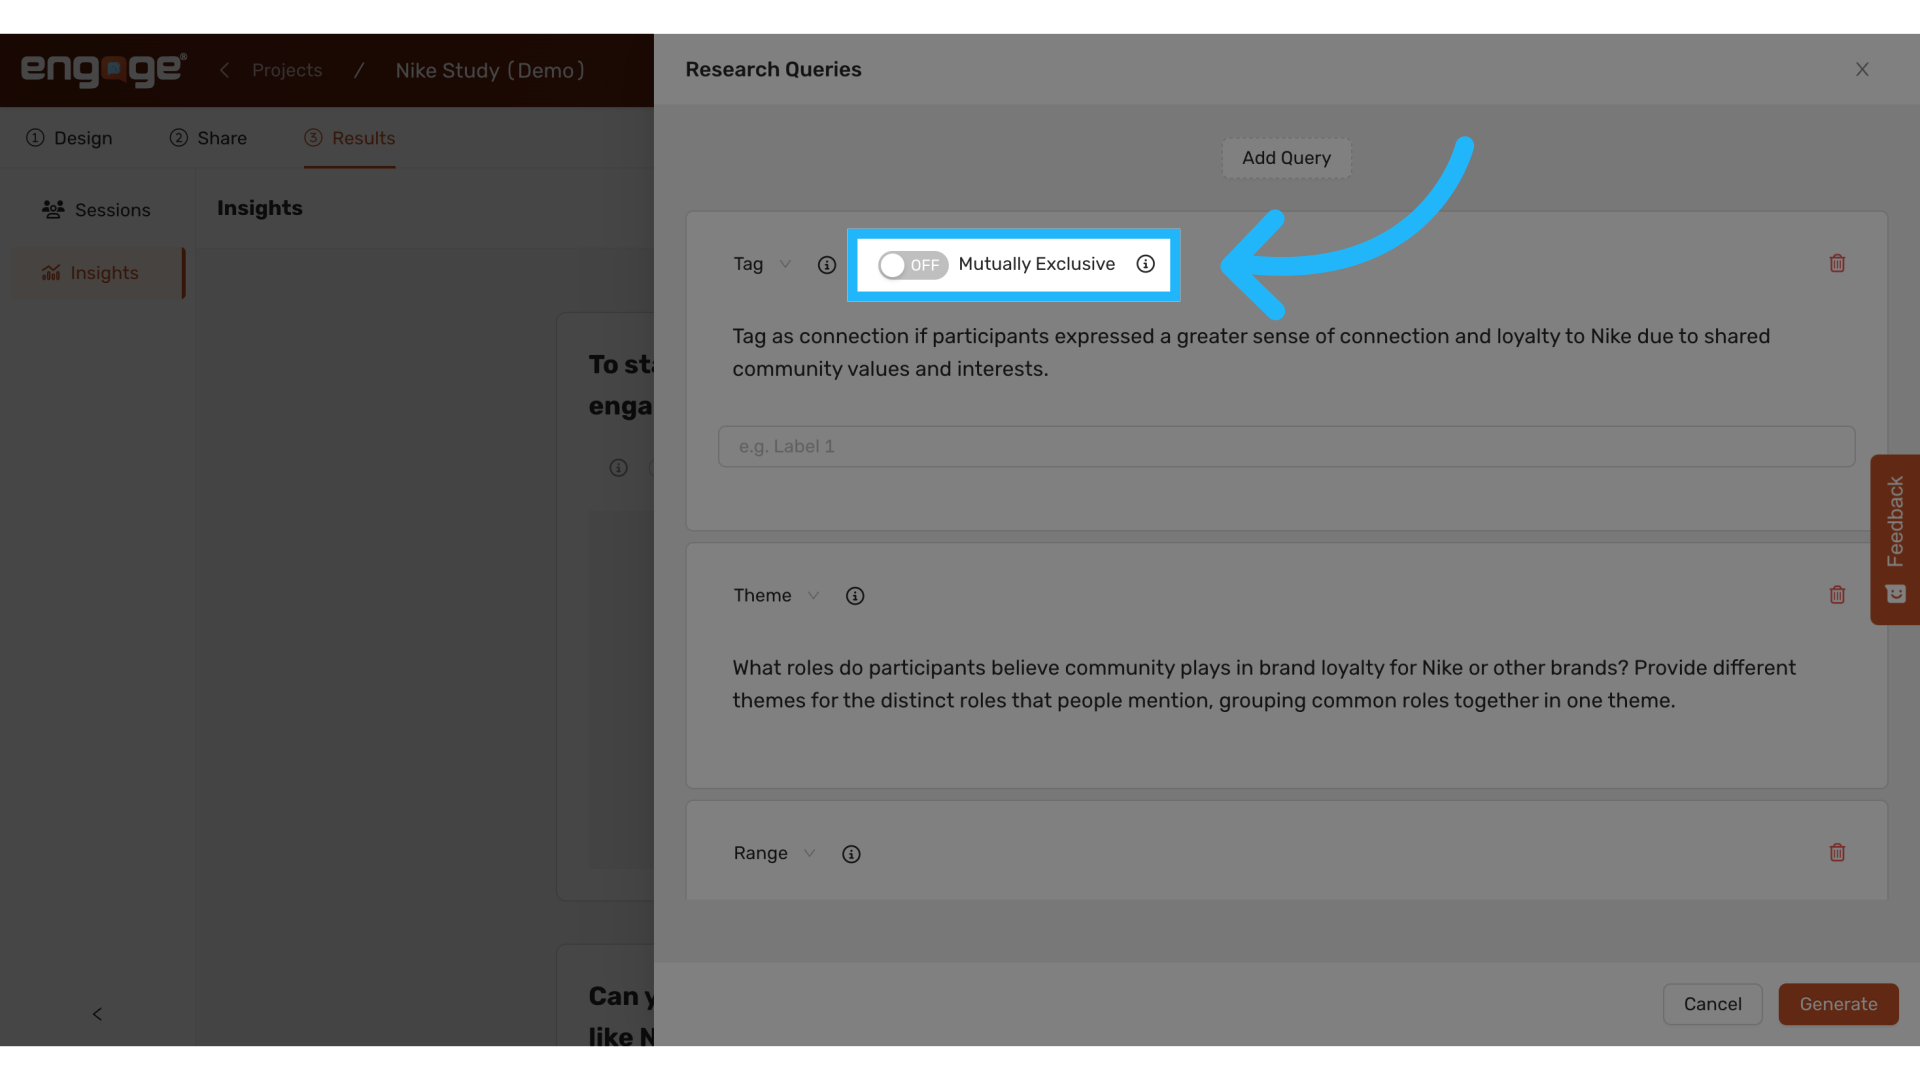
22. Set Tag Exclusivity
Determine if tags should be mutually exclusive, ensuring each data point is labeled only once for precise analysis.
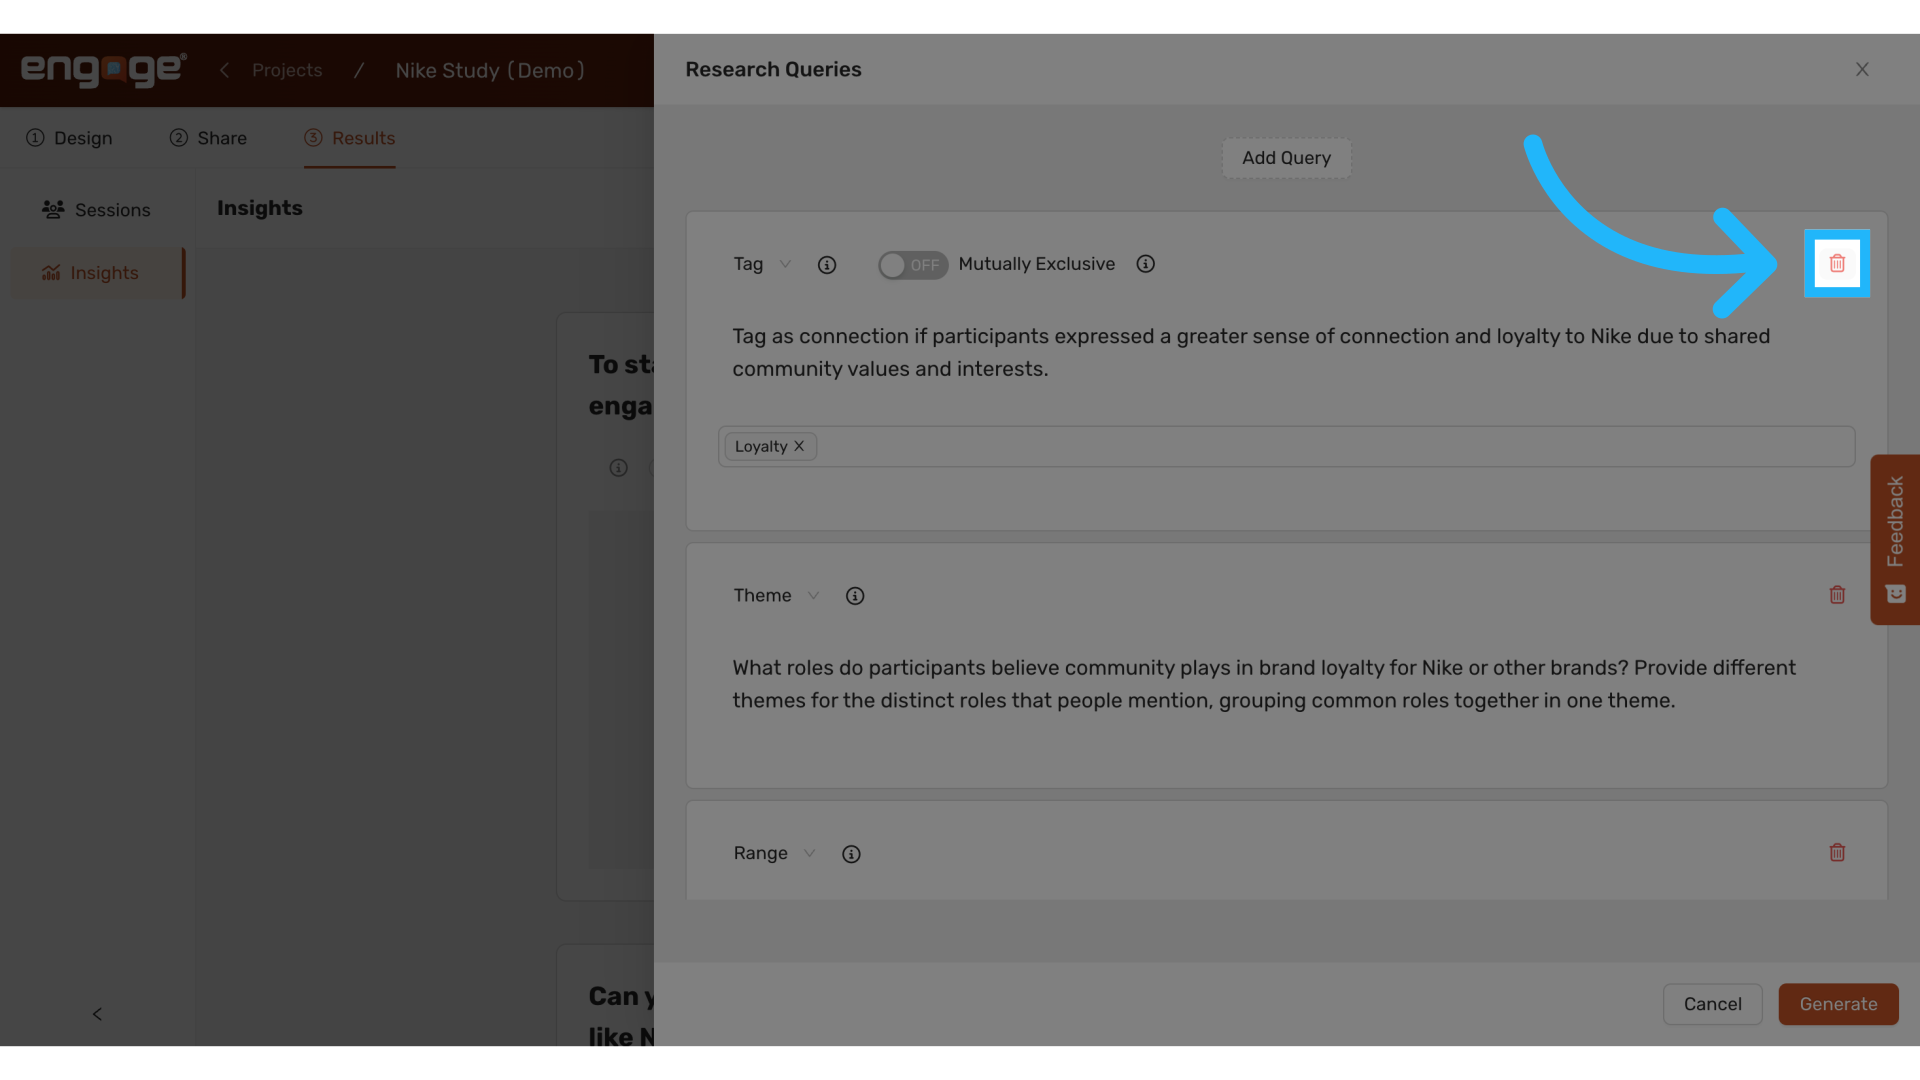
23. Delete Queries
Remove any unnecessary queries.
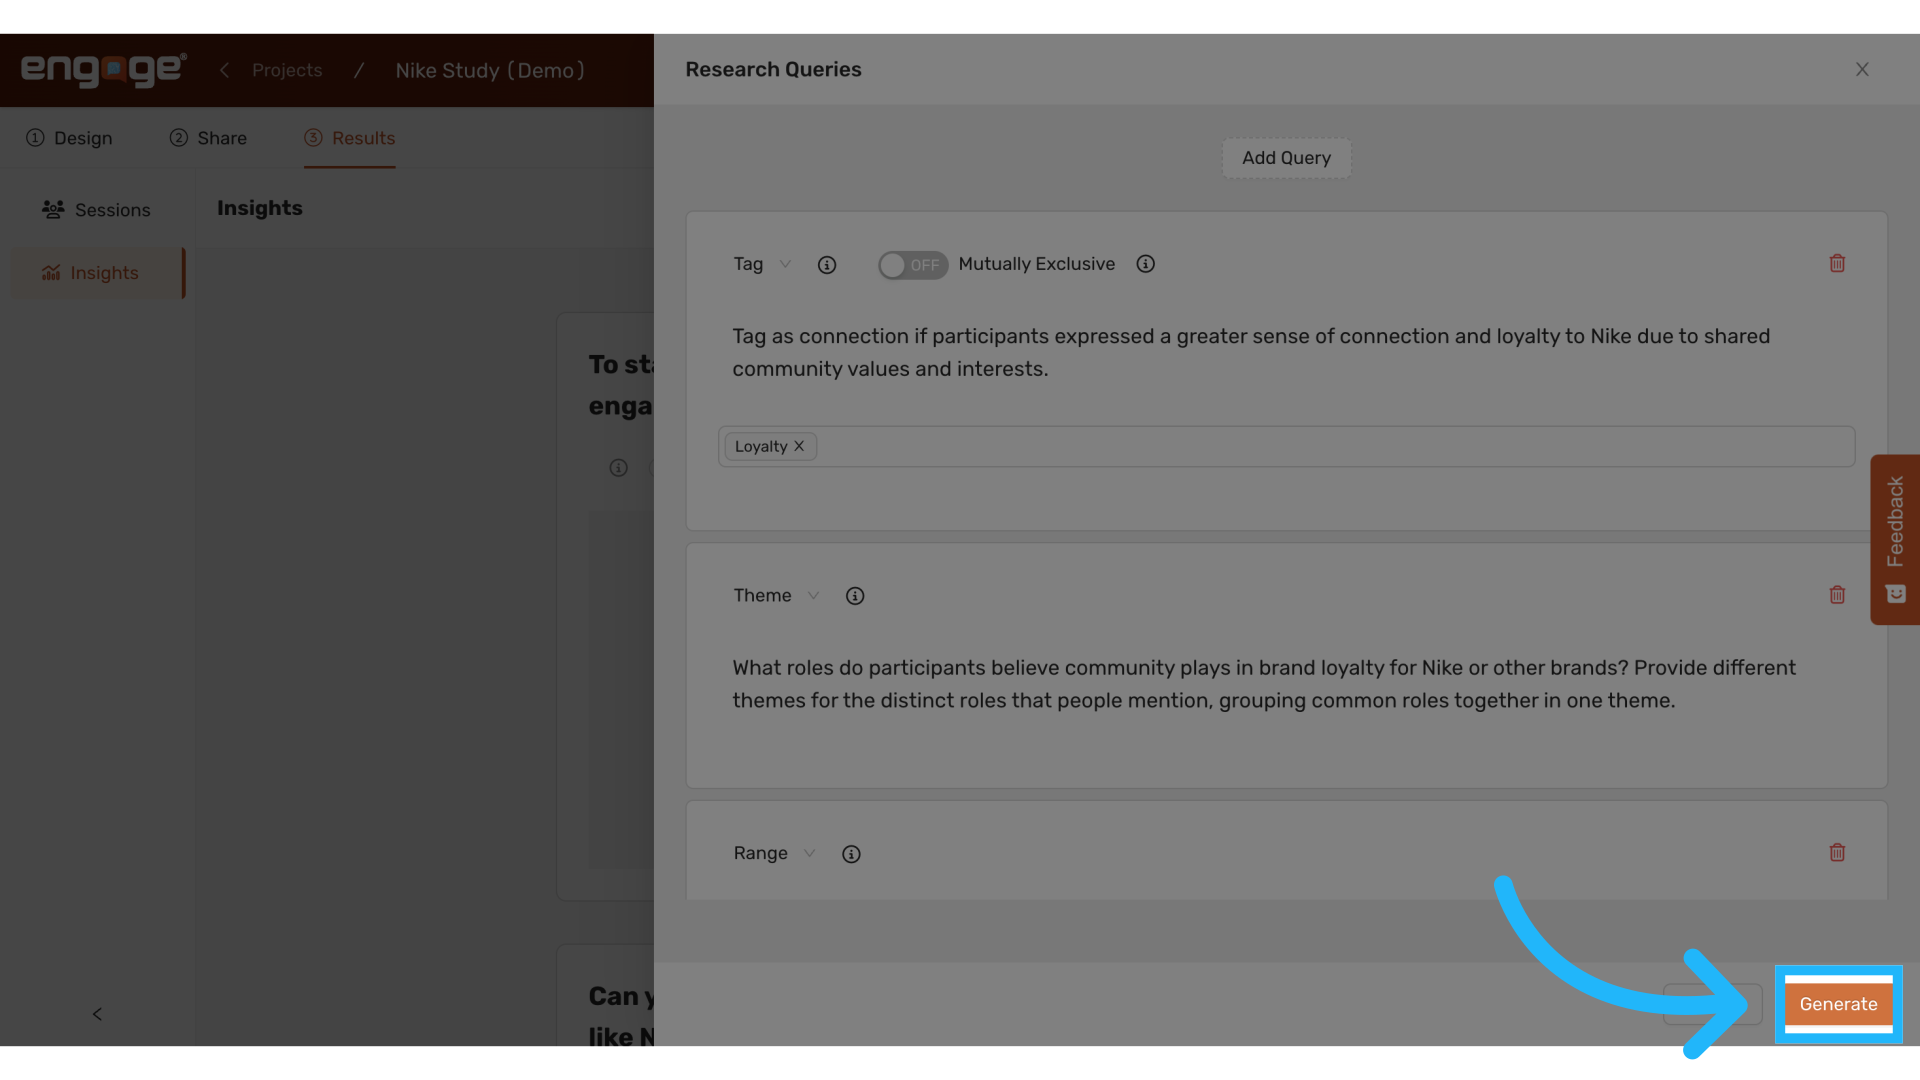
24. Generate Insights
Once you've set up your queries, proceed by clicking the Generate button. This action will initiate the process of insight generation based on the criteria you've established.
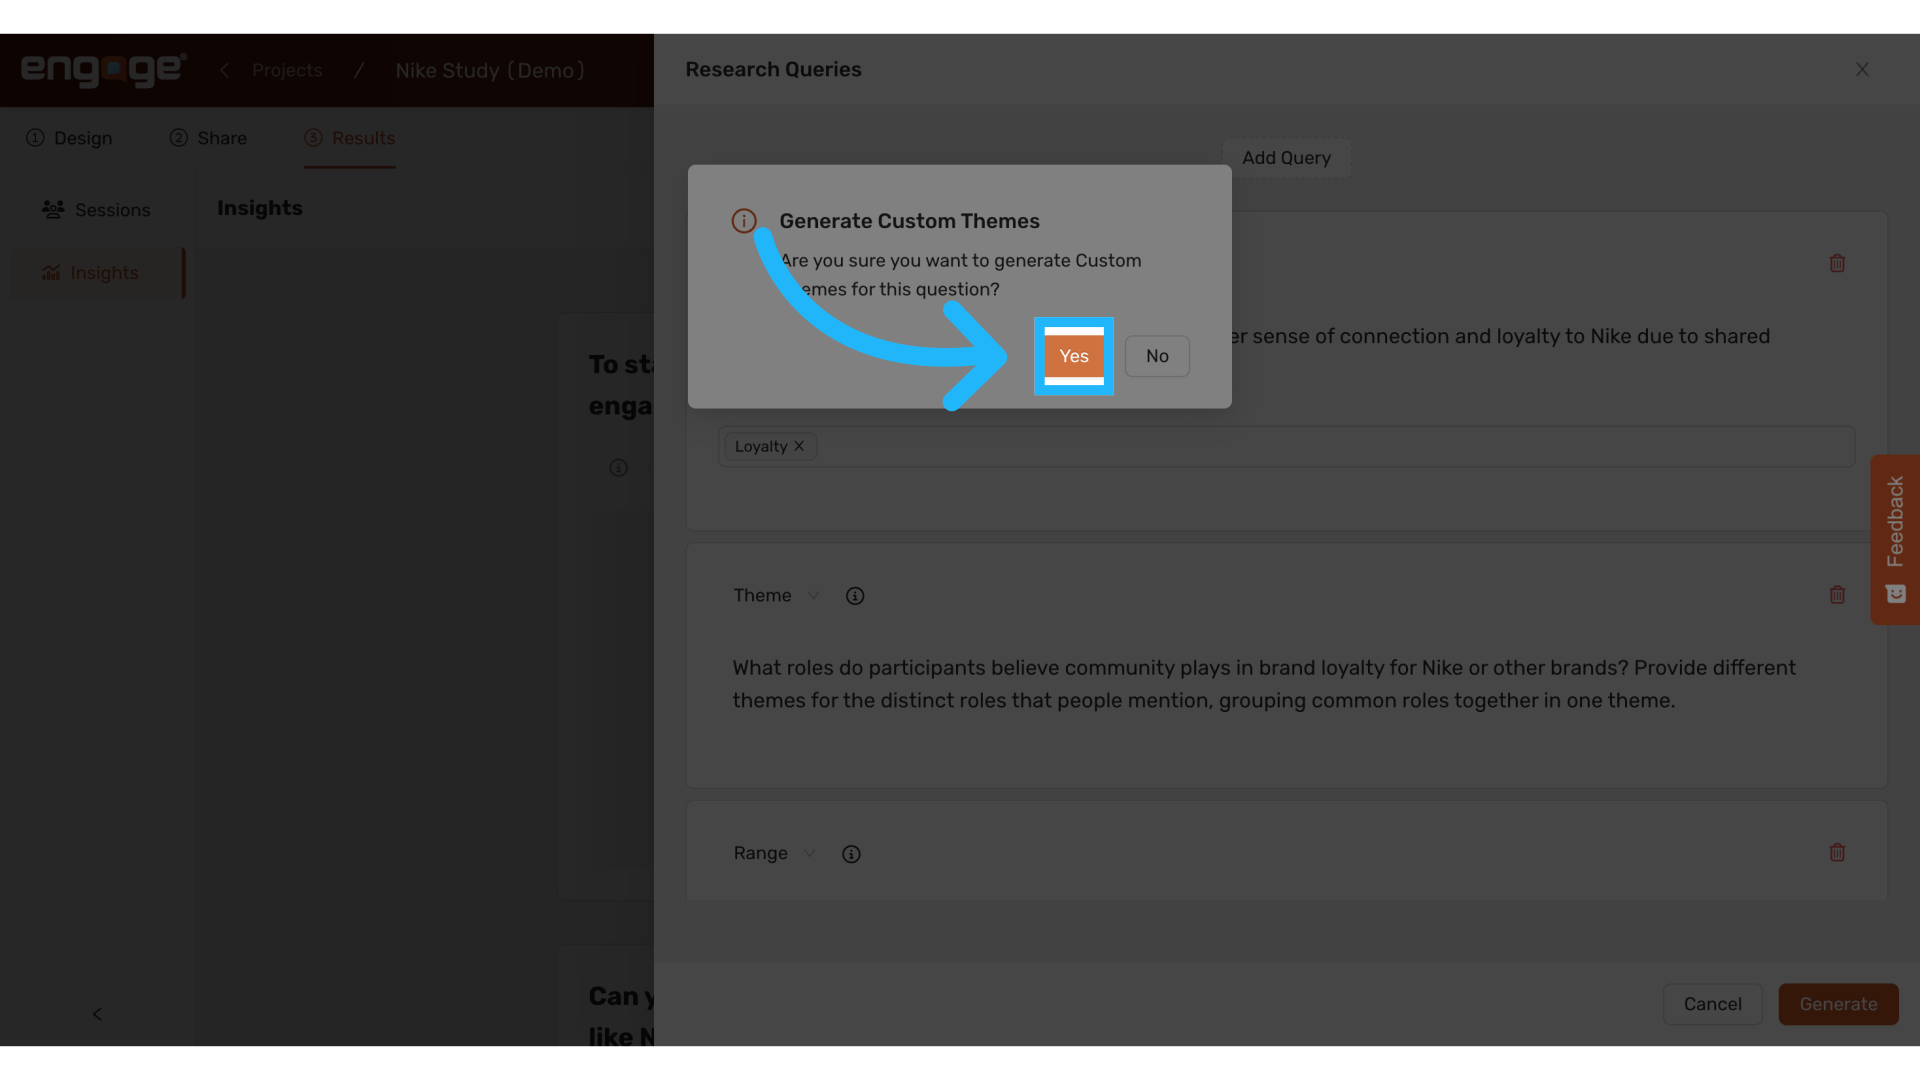
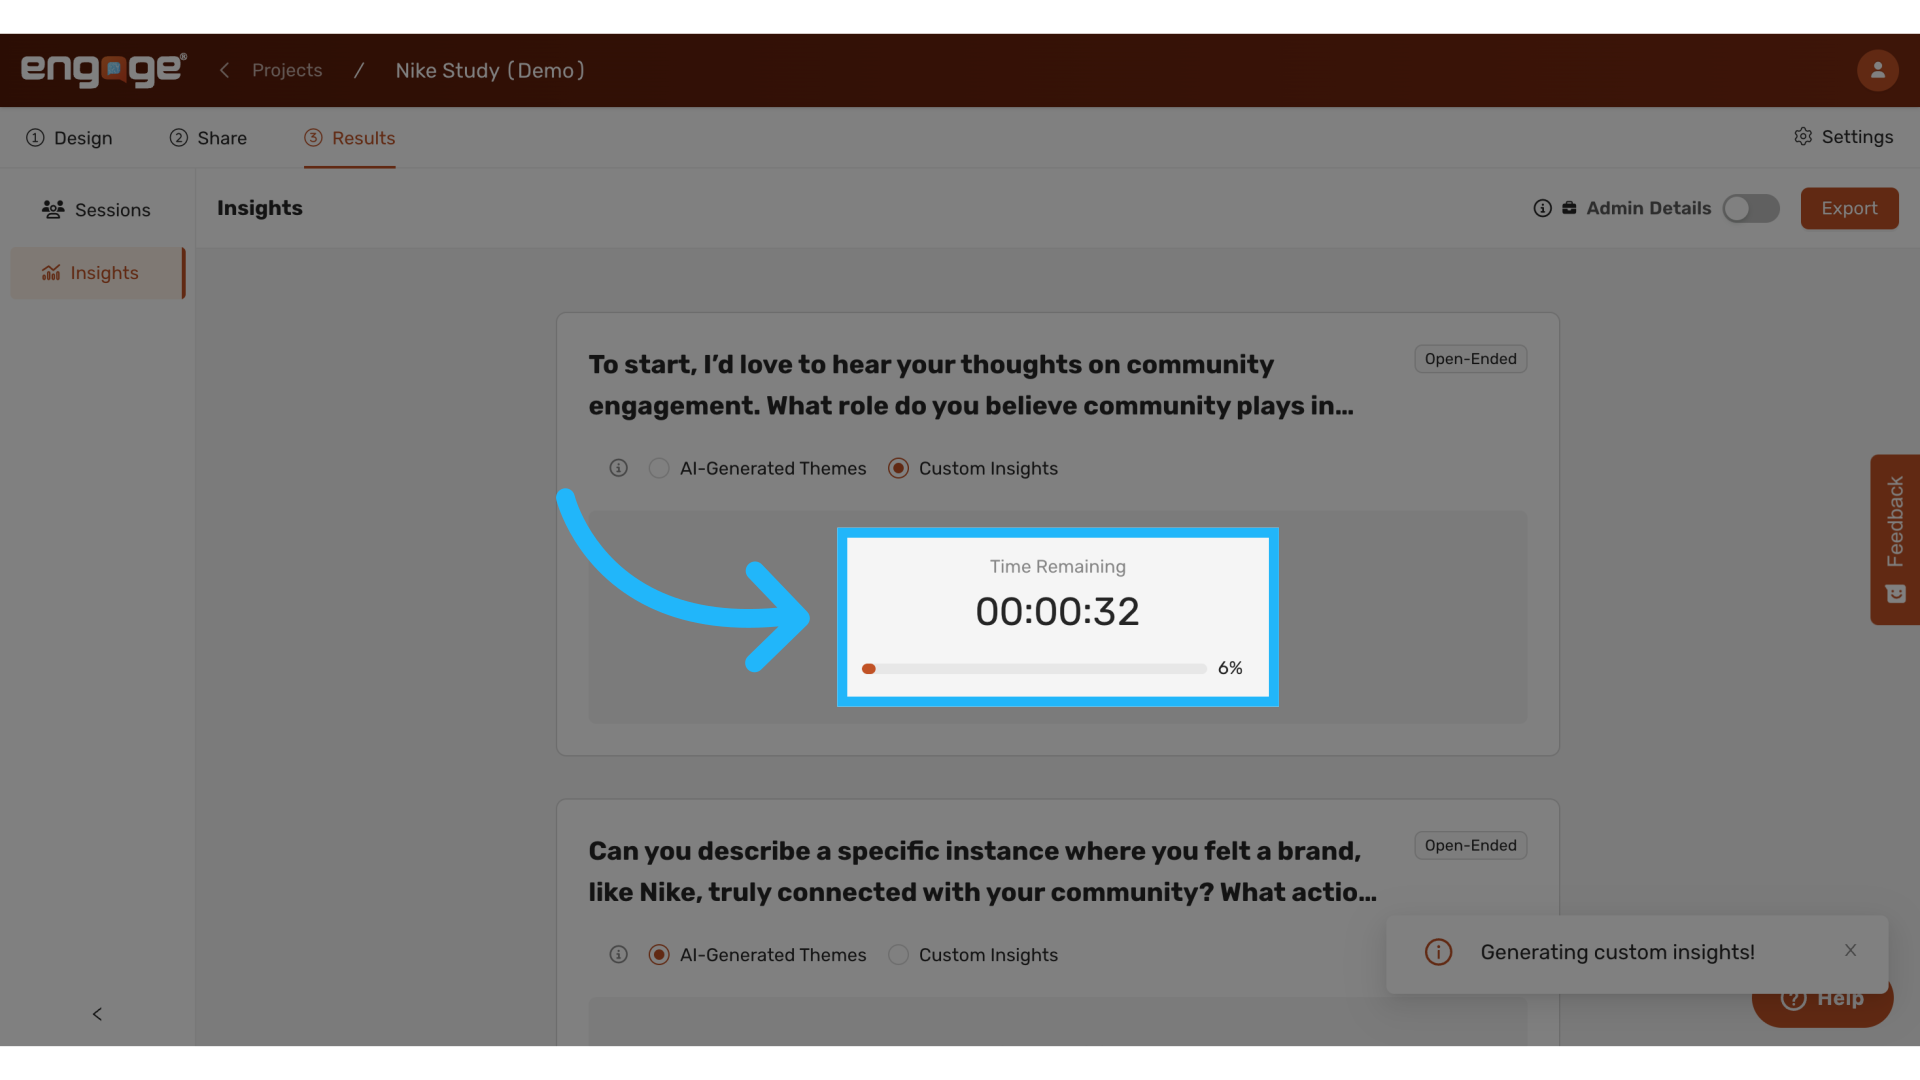
25. Confirm Insights Generation
Post-confirmation, a timer will display the estimated time remaining until the insights are ready. This helps in managing your time efficiently while waiting for the results.
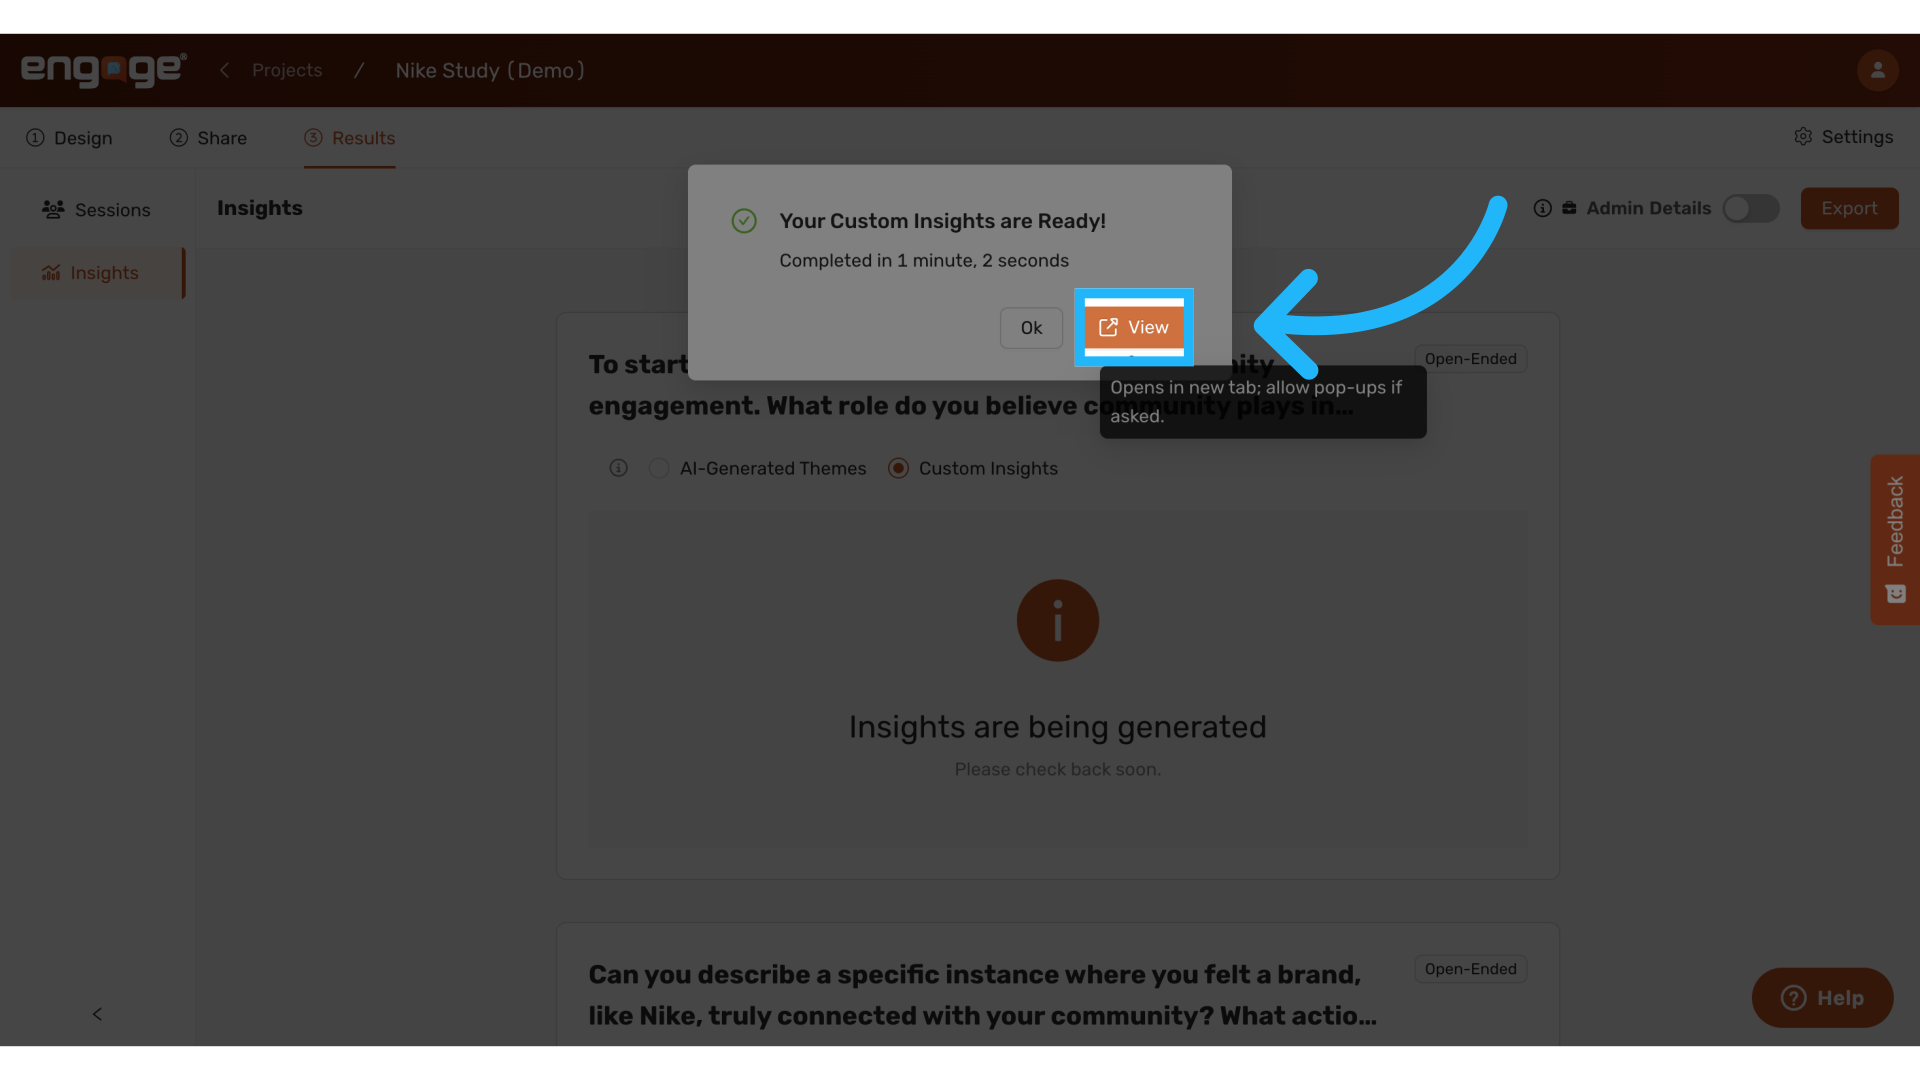
26. View Custom Insights
When the analysis is complete, a notification will pop up to inform you that the insights are ready. You can then view the results to start interpreting the data.
27. Analyze Theme Prominence
The interface will show how prominent each theme is within your dataset, helping you to prioritize areas that may require more focus or that are of significant interest.
28. View Range Averages
For range-based queries, the average values will be displayed, giving you a quantitative measure of where responses generally lie on the specified scales.
29. View Number of Tags
Review how many unique tags were applied, which helps in understanding the diversity of responses or opinions within the collected data.
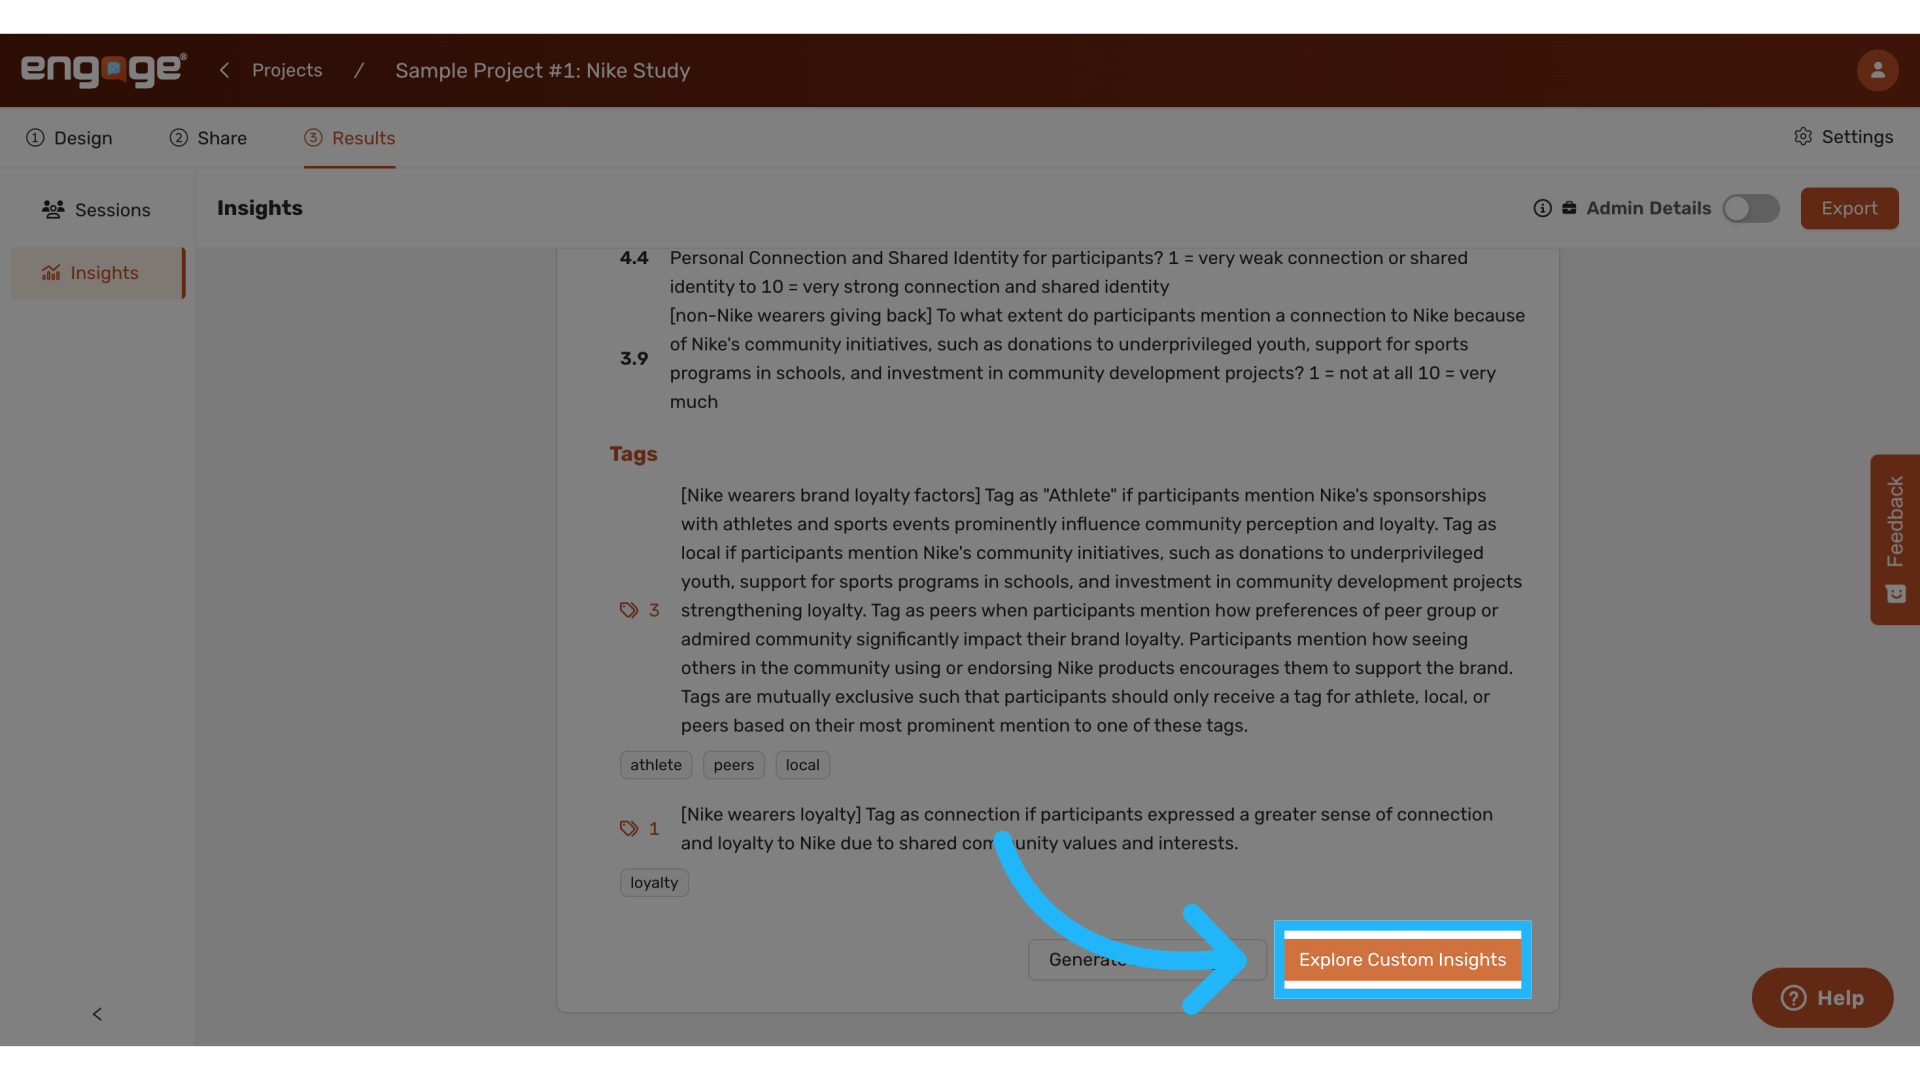
30. Explore Custom Insights
Finally, use the insights interface to explore the data more deeply. This exploration can yield valuable insights into the nuances of the data, guiding future decisions or further research. For information on exploring insights, watch our guide on exploring insights.
Thank you for watching. If you have any other questions, please reach out to our support team or access our other guides.
Comments
0 comments
Please sign in to leave a comment.